Unit 6 Assignment 1
Data collection
The aim of the quantitative analysis of protein experiment was to make a standard curve
of protein using biuret reagent and then accurately determine the concentration of
protein in the urine sample to send to the trial coordinator.
Materials used for the experiment were:
● 14 Test tubes
● Glass/ plastic pipettes
● Biuret reagent
● Colorimeter
● Distilled water
● Urine sample
● 7 Plastic cuvettes
Method:
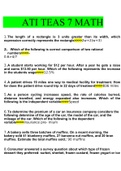
1. A standard curve was made by creating 7 different solutions into 7 different test
tubes.
2. The solution was made using a glass pipette and mixing different amounts of
BSA with different amounts of distilled water in order for various concentrations of
protein to have been made. (measurements of what was added are highlighted in
the table below).
Test tube no. Concentration of Amount of BSA Amount of
protein (mg/cm3) (10mg/cm3) cm3 distilled water
cm3
1 0 0 5
2 1 0.5 4.5
3 2.5 1.25 3.75
4 5 2.5 2.5
5 7.5 3.75 1.25
6 10 5 0
7 Urine sample 0 0
, Unit 6 Assignment 1
3. After samples were made, a fresh set of test tubes were set up, labelled 1 to 7.
4. 2cm3 of each referenced sample was pipetted into the correctly labelled tube.
5. Then 2cm3 of biuret reagent was added to each sample using a plastic pipette.
6. After that, the samples were mixed.
7. Each sample from the fresh set of test tubes was then put into 7 cuvettes using a
plastic pipette.
8. The colorimeter was calibrated at wavelength 520nm with sample 1 (the
colorimeter would have read zero - no protein, no absorbance - the background
absorbance of the biuret solution alone was being looked at.)
9. All the readings from the colourimeter of the samples were put into the table.
10. The results were shown to the lecturer and accuracy was discussed.
11. All samples were disposed of in the sink.
12. The lab was then tidied and so everything was put away.
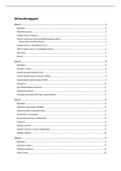
13. A graph was plotted of absorbance against concentration of protein. A line of
best fit was drawn going through zero.
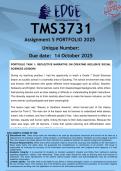
Results
Test tube no. Concentration of Protein, Absorbance , 520 nm
mg/cm3
1 0 0
2 1 0.17
3 2.5 0.21
4 5 0.379
5 7.5 0.64
6 10 0.72
7 To be determined 0.205
From the graph, the to be determined concentration can be calculated as 2.8 mg/cm3.
Data collection
The aim of the quantitative analysis of protein experiment was to make a standard curve
of protein using biuret reagent and then accurately determine the concentration of
protein in the urine sample to send to the trial coordinator.
Materials used for the experiment were:
● 14 Test tubes
● Glass/ plastic pipettes
● Biuret reagent
● Colorimeter
● Distilled water
● Urine sample
● 7 Plastic cuvettes
Method:
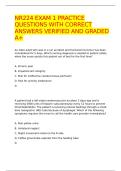
1. A standard curve was made by creating 7 different solutions into 7 different test
tubes.
2. The solution was made using a glass pipette and mixing different amounts of
BSA with different amounts of distilled water in order for various concentrations of
protein to have been made. (measurements of what was added are highlighted in
the table below).
Test tube no. Concentration of Amount of BSA Amount of
protein (mg/cm3) (10mg/cm3) cm3 distilled water
cm3
1 0 0 5
2 1 0.5 4.5
3 2.5 1.25 3.75
4 5 2.5 2.5
5 7.5 3.75 1.25
6 10 5 0
7 Urine sample 0 0
, Unit 6 Assignment 1
3. After samples were made, a fresh set of test tubes were set up, labelled 1 to 7.
4. 2cm3 of each referenced sample was pipetted into the correctly labelled tube.
5. Then 2cm3 of biuret reagent was added to each sample using a plastic pipette.
6. After that, the samples were mixed.
7. Each sample from the fresh set of test tubes was then put into 7 cuvettes using a
plastic pipette.
8. The colorimeter was calibrated at wavelength 520nm with sample 1 (the
colorimeter would have read zero - no protein, no absorbance - the background
absorbance of the biuret solution alone was being looked at.)
9. All the readings from the colourimeter of the samples were put into the table.
10. The results were shown to the lecturer and accuracy was discussed.
11. All samples were disposed of in the sink.
12. The lab was then tidied and so everything was put away.
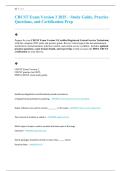
13. A graph was plotted of absorbance against concentration of protein. A line of
best fit was drawn going through zero.
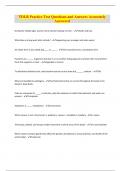
Results
Test tube no. Concentration of Protein, Absorbance , 520 nm
mg/cm3
1 0 0
2 1 0.17
3 2.5 0.21
4 5 0.379
5 7.5 0.64
6 10 0.72
7 To be determined 0.205
From the graph, the to be determined concentration can be calculated as 2.8 mg/cm3.