SPSS LECTURE 4: LINEAR REGRESSION 3
Field chapter 10: regression with dummies
Geen PROCESS in SPSS exam
CATEGORISCHE PREDICTORS IN REGRESSION
• Bij regressieanalyse verzamel je vaak data over groepen van mensen (patienten vs
controls; mannen vs vrouwen; or first-, second-, third-year students).
• De variabele die de groep defenieert is categorisch en kan niet geïncludeerd worden in
de regressieanalyse, omdat de scores op deze variabele vaak ordinaal zijn.
• Het kan geïncludeerd worden als je het transformeert naar een dummy variabele.
• Dummies hebben maar twee scores: 0 and 1; ✓ E.g. geslacht → mannen = 0; vrouwen
=1
• In this special case the regression coefficient verteld iets over de verschillen tussen de
groepen.
Dummy coding
• Het aantal dummy-variables die we nodig hebben voor elke grouping variable =
number of groups – 1
o Example: V1 (training A, training B, no training)
o We need two dummies (D1, D2) to code V1
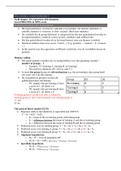
• Je moet één groep kiezen als referentiegroep (e.g. the no training), deze groep heeft
een score van 0 op elke dummy.
• De overgebleven groepen worden elk
gedefinieerd door een dummy.
o D1: people who got training A have
a score of 1, all others a 0.
o D2: people who got training B have
a score of 1, all others a 0.
Training groep A vas the rest. Dus is iemand in
training groep A. het is niet exclusief voor training groep A
1= yes
0= no
The general linear model (GLM)
• Regressie analyse met dummies is equivalent aan ANOVA:
Y = b0 + b1D1 + b2D2
o b0 = mean of the no training group (referentiegroep)
o b1 = difference between the mean of training A and the no training group,
o b2 = difference between the mean of training B and the no training group
• Predicted score voor no training groep: Y = b0 + (b1 x 0) + (b2 x 0) = b0
• Predicted score voor training A groep: Y = b0 + (b1 x 1) + (b2 x 0) = b0 + b1
• Predicted score voor training B groep: Y = b0 + (b1 x 0) + (b2 x 1) = b0 + b2
• Algemene hypothesen:
o H0 = R2 = 0 (in de populatie) OF:
o H0: β1 = β2 = 0 (H0: µnotraining = µtrainingA = µtrainingB)
• Specifieke hypothesis:
o H0: β1 = 0 (µnotraining = µtrainingA)
o H0: β2 = 0 (µnotraining = µtrainingB)
, Waarom doen we geen ANOVA? We kunnen hier combinatie doen van dummy variables
maar ook andere variabelen. In power analyse: dummy als predictor
VOORBEELD MET KWANTITATIEVE EN CATEGORISCHE PREDICTOR
• We predict maandelijkse income van
extraversie (interval) en level of
education (ordinaal)
o Education: 4 categorieën: (1)
elementary school, (2) high school,
(3) vocational studies, (4)
university
Interpretatie van regressiecoëfficienten
Income = 995.12 + 9.61*extrav +
203.72 highschool +
485.80vocational + 780.35
university
Wat is de predicted income voor educational level = elementary school?
Income(elementary) = 995.12 +
9.61*extrav + (203.72 x 0) + (485.80 x 0)
+ (780.35 x 0) =
995.12 + 9.61*extrav
Reden: we hebben een ongespecificeerde variabele in het design, daarom komt er geen getal
uit maar een formule voor een lijn. We beschrijven dus verschillende modellen voor de
subgroepen.
Wat is de predicted income voor educational level = highschool?
Income (highschool) = 995.12 +
9.61*extrav + (203.72 x 1) + (485.80 x 0) +
(780.35 x 0) =
1198.84 +
9.61*extrav
So on average, people with equal extraversion but with eductional
level = high school, earn € 203.718 more than people with ed. level =
elementary school
Interpretatie van b-coëfficients
• Als mensen gelijk zouden zijn in extraversie, kunnen we concluderen dat hoe hoger
iemands education niveau, hoe hoger hun maandelijkse inkomen.
o Mensen met highschool verdienen 203.72 meer dan mensen met elementary
school.
Field chapter 10: regression with dummies
Geen PROCESS in SPSS exam
CATEGORISCHE PREDICTORS IN REGRESSION
• Bij regressieanalyse verzamel je vaak data over groepen van mensen (patienten vs
controls; mannen vs vrouwen; or first-, second-, third-year students).
• De variabele die de groep defenieert is categorisch en kan niet geïncludeerd worden in
de regressieanalyse, omdat de scores op deze variabele vaak ordinaal zijn.
• Het kan geïncludeerd worden als je het transformeert naar een dummy variabele.
• Dummies hebben maar twee scores: 0 and 1; ✓ E.g. geslacht → mannen = 0; vrouwen
=1
• In this special case the regression coefficient verteld iets over de verschillen tussen de
groepen.
Dummy coding
• Het aantal dummy-variables die we nodig hebben voor elke grouping variable =
number of groups – 1
o Example: V1 (training A, training B, no training)
o We need two dummies (D1, D2) to code V1
• Je moet één groep kiezen als referentiegroep (e.g. the no training), deze groep heeft
een score van 0 op elke dummy.
• De overgebleven groepen worden elk
gedefinieerd door een dummy.
o D1: people who got training A have
a score of 1, all others a 0.
o D2: people who got training B have
a score of 1, all others a 0.
Training groep A vas the rest. Dus is iemand in
training groep A. het is niet exclusief voor training groep A
1= yes
0= no
The general linear model (GLM)
• Regressie analyse met dummies is equivalent aan ANOVA:
Y = b0 + b1D1 + b2D2
o b0 = mean of the no training group (referentiegroep)
o b1 = difference between the mean of training A and the no training group,
o b2 = difference between the mean of training B and the no training group
• Predicted score voor no training groep: Y = b0 + (b1 x 0) + (b2 x 0) = b0
• Predicted score voor training A groep: Y = b0 + (b1 x 1) + (b2 x 0) = b0 + b1
• Predicted score voor training B groep: Y = b0 + (b1 x 0) + (b2 x 1) = b0 + b2
• Algemene hypothesen:
o H0 = R2 = 0 (in de populatie) OF:
o H0: β1 = β2 = 0 (H0: µnotraining = µtrainingA = µtrainingB)
• Specifieke hypothesis:
o H0: β1 = 0 (µnotraining = µtrainingA)
o H0: β2 = 0 (µnotraining = µtrainingB)
, Waarom doen we geen ANOVA? We kunnen hier combinatie doen van dummy variables
maar ook andere variabelen. In power analyse: dummy als predictor
VOORBEELD MET KWANTITATIEVE EN CATEGORISCHE PREDICTOR
• We predict maandelijkse income van
extraversie (interval) en level of
education (ordinaal)
o Education: 4 categorieën: (1)
elementary school, (2) high school,
(3) vocational studies, (4)
university
Interpretatie van regressiecoëfficienten
Income = 995.12 + 9.61*extrav +
203.72 highschool +
485.80vocational + 780.35
university
Wat is de predicted income voor educational level = elementary school?
Income(elementary) = 995.12 +
9.61*extrav + (203.72 x 0) + (485.80 x 0)
+ (780.35 x 0) =
995.12 + 9.61*extrav
Reden: we hebben een ongespecificeerde variabele in het design, daarom komt er geen getal
uit maar een formule voor een lijn. We beschrijven dus verschillende modellen voor de
subgroepen.
Wat is de predicted income voor educational level = highschool?
Income (highschool) = 995.12 +
9.61*extrav + (203.72 x 1) + (485.80 x 0) +
(780.35 x 0) =
1198.84 +
9.61*extrav
So on average, people with equal extraversion but with eductional
level = high school, earn € 203.718 more than people with ed. level =
elementary school
Interpretatie van b-coëfficients
• Als mensen gelijk zouden zijn in extraversie, kunnen we concluderen dat hoe hoger
iemands education niveau, hoe hoger hun maandelijkse inkomen.
o Mensen met highschool verdienen 203.72 meer dan mensen met elementary
school.