Week 1 – Digital Marketing and Analytics
Overview + SEO
Factors Driving Digital Marketing
Average amount of time spent on internet
Accessibility of internet
Mobile penetration
Digital Transformation in companies
Evolution of the Web
Main Trends
Digital transformation
Marketing automation
App marketing
User generated content
Data driven story telling
Touchpoints in Digital Platforms
Note: these different types all have different KPIs
o And they all vary in their investment amount
Paid-Owned-Earned
Marketing Objective and Communication
Paid Media Owned Media Earned Media
The Essence Advertising Content Engagement
Who initiates contact Brand Customer Customer
Form of Brand to Interactive between Customer to
Communication Consumer brand and consumer customer
1
,Metrics and KPIs
Top 10 Metrics Marketers are using to evaluate digital marketing programs
performance
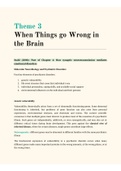
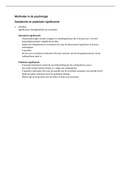
Metrics in Funnel: an example
Right hand side: how do you measure the concept on the left
Left hand side: what the metric is used to measure (the concept)
Explanation: from top to bottom
o You reached 100,000 people, from those your click through rate (CTR)
10% as 10,000 people clicked through to your ad.
Bounce rate, people who visit your website but don’t click any further, they
leave straight away
o From the original 100,000 people 5,000 stayed to read your content
Then move on to the next step, people who sign up for something (e.g.
newsletter)
Then move further down the funnel to see what amount of people you
reached will stick around (in
terms of sales, loyalty or
becoming a customer
advocate)
Impression
Impression is a term that
refers to the point in which
an ad is displayed once on a
webpage
o In other words, when a
customer is exposed to
an online content
advertisement on a
website that he/she
viewed
It does not necessarily mean that the customer actively noticed the content
2
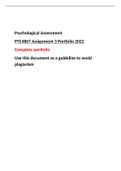
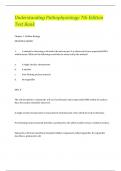
,Viewability Rate
Adds count as viewable
on a desktop if they stay
on screen for more than
one second (so the user
doesn’t have to scroll
down for more content)
For smart phone, only the
top ad counts as viewable
(if seen for at least a
second) before the viewer
scrolls down
Bounce Rate
The percentage of visitors to a particular website who navigate away from
the site after viewing only one page.
o Important to understand: web page effectiveness/success and
engagement
Click Through Rate
The number of clicks that your ad receives divided by the number of times
your ad is shown
o Clicks divided by Impressions = Click through rate
Conversion Rate
Conversion rates are calculated by taking the number
of conversions and dividing that by the number of
total ad time during the same time period
o E.g. 50 conversions from 1,000 clicks you
conversion rate would be 50 divided by 1,000 =
5%
Important of Search Engines
Google is the no. 1 search engine – this course will always use Google as its
search engine perspective
Six factors contributing to google search
o 1. Volume of search
o 2. Growth in search volume
o 3. Accessibility
o 4. Time spent on Internet
o 5. Role of search in Website Traffic
o 6. Important of search in shopping behaviour
Volume
40,000 search queries every second on average, 3.5 billion search per day
and 1.2 trillion searches per year
Growth
Google doesn’t provide volume data, but it is assumed that beyond 2016 it is
roughly processing more than two trillion queries per year
o On average there is a 10% growth in volume year on year
3
, Search Accessibility
Almost 50% of the world’s population has access to the internet!
Time spent on Google
Not only internet is becoming accessible, we are also spending more time on
Google Searches
An average person conducts 3-4 searches every single day which translates
to
o 1 hour, 47 minutes and 42 seconds
*Average time a person spend per month on Google Search
queries
Unique visitors: Google gets about 1.53 billion unique visitors per month on
average
Unique searches: 15% of all searches have never been searched before on
google
o E.g. before the Corona virus no one was googling it, so pre December
2019 no one had looked for it
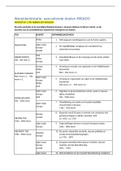
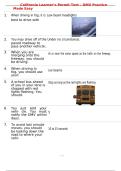
Search behaviour in Shopping
Figure shows how much % of
respondents used Google Search via
their Smartphone or computer/tablet
in each phase of the buying cycle
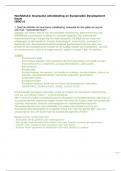
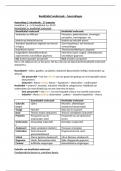
Search Behaviour: Online Website Traffic
Figure shows average % of website
traffic from different sources
In summary:
Google search is an integral part of
our life
We are spending more and more time
on Google search
Increase in search volume + growth
Integration of search in shopping behaviour
Search contribution in website traffic
It is because of this that it is a great opportunity for Marketers to use this
medium for advertising
Search Engine Marketing
SEM = Search Engine Optimisation (SEO)
+ Search Engine Advertising (SEA)
SEO – Organic
o “How do I make my website
relevant for the searched
keyword?”
o Goal is to be in the top links in the
organic part of the page – lead to
90%
o So your organic ranking needs to
be solid!
4
Overview + SEO
Factors Driving Digital Marketing
Average amount of time spent on internet
Accessibility of internet
Mobile penetration
Digital Transformation in companies
Evolution of the Web
Main Trends
Digital transformation
Marketing automation
App marketing
User generated content
Data driven story telling
Touchpoints in Digital Platforms
Note: these different types all have different KPIs
o And they all vary in their investment amount
Paid-Owned-Earned
Marketing Objective and Communication
Paid Media Owned Media Earned Media
The Essence Advertising Content Engagement
Who initiates contact Brand Customer Customer
Form of Brand to Interactive between Customer to
Communication Consumer brand and consumer customer
1
,Metrics and KPIs
Top 10 Metrics Marketers are using to evaluate digital marketing programs
performance
Metrics in Funnel: an example
Right hand side: how do you measure the concept on the left
Left hand side: what the metric is used to measure (the concept)
Explanation: from top to bottom
o You reached 100,000 people, from those your click through rate (CTR)
10% as 10,000 people clicked through to your ad.
Bounce rate, people who visit your website but don’t click any further, they
leave straight away
o From the original 100,000 people 5,000 stayed to read your content
Then move on to the next step, people who sign up for something (e.g.
newsletter)
Then move further down the funnel to see what amount of people you
reached will stick around (in
terms of sales, loyalty or
becoming a customer
advocate)
Impression
Impression is a term that
refers to the point in which
an ad is displayed once on a
webpage
o In other words, when a
customer is exposed to
an online content
advertisement on a
website that he/she
viewed
It does not necessarily mean that the customer actively noticed the content
2
,Viewability Rate
Adds count as viewable
on a desktop if they stay
on screen for more than
one second (so the user
doesn’t have to scroll
down for more content)
For smart phone, only the
top ad counts as viewable
(if seen for at least a
second) before the viewer
scrolls down
Bounce Rate
The percentage of visitors to a particular website who navigate away from
the site after viewing only one page.
o Important to understand: web page effectiveness/success and
engagement
Click Through Rate
The number of clicks that your ad receives divided by the number of times
your ad is shown
o Clicks divided by Impressions = Click through rate
Conversion Rate
Conversion rates are calculated by taking the number
of conversions and dividing that by the number of
total ad time during the same time period
o E.g. 50 conversions from 1,000 clicks you
conversion rate would be 50 divided by 1,000 =
5%
Important of Search Engines
Google is the no. 1 search engine – this course will always use Google as its
search engine perspective
Six factors contributing to google search
o 1. Volume of search
o 2. Growth in search volume
o 3. Accessibility
o 4. Time spent on Internet
o 5. Role of search in Website Traffic
o 6. Important of search in shopping behaviour
Volume
40,000 search queries every second on average, 3.5 billion search per day
and 1.2 trillion searches per year
Growth
Google doesn’t provide volume data, but it is assumed that beyond 2016 it is
roughly processing more than two trillion queries per year
o On average there is a 10% growth in volume year on year
3
, Search Accessibility
Almost 50% of the world’s population has access to the internet!
Time spent on Google
Not only internet is becoming accessible, we are also spending more time on
Google Searches
An average person conducts 3-4 searches every single day which translates
to
o 1 hour, 47 minutes and 42 seconds
*Average time a person spend per month on Google Search
queries
Unique visitors: Google gets about 1.53 billion unique visitors per month on
average
Unique searches: 15% of all searches have never been searched before on
o E.g. before the Corona virus no one was googling it, so pre December
2019 no one had looked for it
Search behaviour in Shopping
Figure shows how much % of
respondents used Google Search via
their Smartphone or computer/tablet
in each phase of the buying cycle
Search Behaviour: Online Website Traffic
Figure shows average % of website
traffic from different sources
In summary:
Google search is an integral part of
our life
We are spending more and more time
on Google search
Increase in search volume + growth
Integration of search in shopping behaviour
Search contribution in website traffic
It is because of this that it is a great opportunity for Marketers to use this
medium for advertising
Search Engine Marketing
SEM = Search Engine Optimisation (SEO)
+ Search Engine Advertising (SEA)
SEO – Organic
o “How do I make my website
relevant for the searched
keyword?”
o Goal is to be in the top links in the
organic part of the page – lead to
90%
o So your organic ranking needs to
be solid!
4