Economics 2 IB
Chapter 2
Chapter 2.1 Demand
Perfect competition = a situation where the consumers and producers of a product are price takers, perfectly
competitive market
Price taker = a person or firm with no power to be able to influence the market price
Law of demand = the quantity of a good demanded per period of time will fall as price rises and will rise as
price fall, other things being equal
Income effect = the effect of a change in price on quantity demanded arising from the consumer becoming
better or worse off as a result of the price change
Substitute effect = the effect of change in price on quantity demanded arising from the consumer switching to
or from alternative (substitute) products
2 reasons for law of demand:
- Income effect
- Substitution effect
The income and substitution effects are useful concepts as they help to explain why people react to a price rise
by buying less. The size of these effects depends on a range of factors. These factors determine the shape of
the demand curve.
Quantity demanded = the amount of a good that a consumer is willing and able to but at a given price over a
given period of time.
Demand schedule for an individual = a table showing the different quantities of a good that a person is willing
and able to buy at various prices over a given period of time
Market demand schedule = a table showing the different total quantities of a good that consumers are willing
and able to buy at various prices over a given period of time
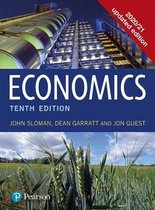
Demand curve = a graph showing the relationship between the price of a good and the quantity of the good
demanded over a given time period. Price is measured on the vertical axis: quantity demanded is measured on
the horizontal axis. A demand curve can be for an individual consumer or group of consumers, or more usually
for the whole market.
When the demand of a product increases the demand curve moves to the right
Qd Quantity demanded
P Price of the good
Y Consumer incomes
Ps Particular substitute
Pc Particular complement
This equation is based on a ceteris paribus assumption: it’s assumed that all the other determinants of demand
remain constant. Thus an equation relating quantity demanded to price could be in the form: Qd = a – bP
If one of these other determinants changed, the equation itself would change. There would be a shift in the
curve: a change in demand. If a the a term alone changed, there would be a parallel shift in the curve. If the b
term changed, the slope of the curve would change. Simple equations can be used to relate demand to other
determinants too. For example, an equation relation quantity demanded to income would be in the form:
,Qd = a + bY
In a similar way, we can relate the quantity demanded to two or more determinants. For example a demand
function could be of the form: Qd = a – bP + cY + dPs – ePc
This equation says that the quantity demanded (Qd) will fall as the price of the good (P) rises, will rise as the
level of consumer incomes (Y) rises, will rise as the price of a particular substitute (Ps) rises and will fall as the
price of a particular complement (Pc) rises, by amounts b,c,d, and e respectively.
What factors make the demand curve move?
Taste
Increase The more desirable people find the good, the more they will demand it, tastes are RIGHT
affected by ads, by trends and fashion, by observing other consumers, by
considerations of health and by the experience of consuming the good on previous
occasions
Decrease The recent fashion for men to grow beards has gad a negative impact on the demand LEFT
for razors
The number and price of substitute goods
Increase The higher the price of substitute goods, the higher will be the demand for this good RIGHT
as people switch from the substitutes. If the price cigarettes increases, the demand
for e-cigarettes will rise.
Decrease If the price of competitive/substitute goods decreases, the demand of the product will LEFT
decrease.
The number and price of complementary goods
Increase The higher the price of complementary goods, the fewer of them will be bought and LEFT
in price hence the less will be the demand for the good under consideration.
Decrease The lower the price of complementary goods, the higher the demand. RIGHT
in price
Income
Increase As people’s income rise, their demand for most goods will rise, such goods are called RIGHT
normal goods
Decrease There are exceptions to this general rule, however, as people get richer, they spent LEFT
less on inferior goods such as supermarket ‘value’ ranges and switch to better quality
goods
Distribution of income
If national income were redistributed from the poor to the rich, the demand for luxury goods would rise. At
the same time, as the poor get poorer they might have to buy more inferior goods; demand for these would
rise too.
Expectations of future prices changes
Increase If people think that prices are going to rise in the future, they are likely to buy more RIGHT
, now, before the prices go up
Decrease People postpone their purchases because the product will be cheaper in the future so LEFT
the demand will decrease
When the price changes the demand curve will not move, the coordinate on the curve will only move but the
curve stays on the same place.
Demand function = an equation which shows the mathematical relationship between the quantity demanded
of a good and the values of the various determinants of demand.
Regression analysis = a statistical technique which allows a functional relationship between two or more
variables to be estimated
Econometrics = the science of applying statistical techniques to economic data in order to identify and test
economic relationships.
SUMMARY
1. When the price of a good rises, the quantity demanded per period of time will fall. This is known as the
‘law of demand’. It applies both to individuals’ demand and to the whole market
2. The law of demand is explained by the income and substitution effect of a price change.
3. The relationship between price and quantity demanded per period of time can be shown in a table or
schedule or as a graph. On the graph, price is plotted on the vertical axis and quantity demanded per
period of time is on the horizontal axis. The curve resulting demand curve is downward sloping (negative
sloped)
4. Other determinants of demand include: tastes, the number and price of substitute goods, the number and
price complementary goods, income, distribution of income and expectations of future price changes
5. If price changes, the effect is shown by a movement along the demand curve. We call this effect ‘a change
in the quantity demanded’
6. If any other determinant of demand changes, the whole curve will shift. We call this effect ‘a change in
demand’ a rightward shift represents an increase in demand; a leftward shift represents a decrease in
demand
7. The relationship between the quantity demanded and the various determinants of demand (including
price) can be expressed as an equation.
Chapter 2.2 Supply
The general relationship between supply and price: when the price of a good rises, the quantity supplied will
also rise.
8.
, Chapter 6
Chapter 6.1
The cost of producing any level of output will depend on the amount of inputs used and the
price the firm must pay for them.
Short- and long-run changes in production
If a firm wants to increase production, it will take time to acquire a greater quantity of
certain inputs. If a firm wants to increase output relatively quickly, it will only be able to
increase the quantity of certain inputs, but it will have to work with its existing buildings and
machinery. A fixed factor is an input that cannot be increased within a given time period. A
variable factor is one that can.
We also distinguish short-run and long-run. Short-run is a time period during which at least
one factor of production is fixed. Output can be increased only by using more variable
factors. The long-run is a time period long enough for all inputs to be varied. The actual
length of the short- and long-run will differ.
The law of diminishing returns
Production in the short-run is subject to diminishing returns. When one or more factors are
held fixed, there will come a point beyond which the extra output from additional units of
the variable factor will diminish.
When a variable factor is added to a fixed factor, the total output that results it called the
total physical product (TPP). The relation between inputs and output is shown in a
production function. The production function gives the relationship between quantities of
physical inputs and quantities of output of goods. A firm is technically efficient when the firm
is producing as much output as is technologically possible given the quantity of factor inputs
it is using. All the points along the total physical product are technically efficient. Any point
below is technically inefficient.
In reality, total output from any given combination of inputs may be lower than the
production function indicates because of inefficient management and methods of
production. The level of production is also assumed to be constant. If there is technological
progress, the whole production function would change.
Average physical product
This is output (TPP) per unit of the variable factor. APP = TPP/Q
Marginal physical product
This is the extra output produced by employing one more unit of the variable factor. MPP =
change in TPP/change in Q
Chapter 2
Chapter 2.1 Demand
Perfect competition = a situation where the consumers and producers of a product are price takers, perfectly
competitive market
Price taker = a person or firm with no power to be able to influence the market price
Law of demand = the quantity of a good demanded per period of time will fall as price rises and will rise as
price fall, other things being equal
Income effect = the effect of a change in price on quantity demanded arising from the consumer becoming
better or worse off as a result of the price change
Substitute effect = the effect of change in price on quantity demanded arising from the consumer switching to
or from alternative (substitute) products
2 reasons for law of demand:
- Income effect
- Substitution effect
The income and substitution effects are useful concepts as they help to explain why people react to a price rise
by buying less. The size of these effects depends on a range of factors. These factors determine the shape of
the demand curve.
Quantity demanded = the amount of a good that a consumer is willing and able to but at a given price over a
given period of time.
Demand schedule for an individual = a table showing the different quantities of a good that a person is willing
and able to buy at various prices over a given period of time
Market demand schedule = a table showing the different total quantities of a good that consumers are willing
and able to buy at various prices over a given period of time
Demand curve = a graph showing the relationship between the price of a good and the quantity of the good
demanded over a given time period. Price is measured on the vertical axis: quantity demanded is measured on
the horizontal axis. A demand curve can be for an individual consumer or group of consumers, or more usually
for the whole market.
When the demand of a product increases the demand curve moves to the right
Qd Quantity demanded
P Price of the good
Y Consumer incomes
Ps Particular substitute
Pc Particular complement
This equation is based on a ceteris paribus assumption: it’s assumed that all the other determinants of demand
remain constant. Thus an equation relating quantity demanded to price could be in the form: Qd = a – bP
If one of these other determinants changed, the equation itself would change. There would be a shift in the
curve: a change in demand. If a the a term alone changed, there would be a parallel shift in the curve. If the b
term changed, the slope of the curve would change. Simple equations can be used to relate demand to other
determinants too. For example, an equation relation quantity demanded to income would be in the form:
,Qd = a + bY
In a similar way, we can relate the quantity demanded to two or more determinants. For example a demand
function could be of the form: Qd = a – bP + cY + dPs – ePc
This equation says that the quantity demanded (Qd) will fall as the price of the good (P) rises, will rise as the
level of consumer incomes (Y) rises, will rise as the price of a particular substitute (Ps) rises and will fall as the
price of a particular complement (Pc) rises, by amounts b,c,d, and e respectively.
What factors make the demand curve move?
Taste
Increase The more desirable people find the good, the more they will demand it, tastes are RIGHT
affected by ads, by trends and fashion, by observing other consumers, by
considerations of health and by the experience of consuming the good on previous
occasions
Decrease The recent fashion for men to grow beards has gad a negative impact on the demand LEFT
for razors
The number and price of substitute goods
Increase The higher the price of substitute goods, the higher will be the demand for this good RIGHT
as people switch from the substitutes. If the price cigarettes increases, the demand
for e-cigarettes will rise.
Decrease If the price of competitive/substitute goods decreases, the demand of the product will LEFT
decrease.
The number and price of complementary goods
Increase The higher the price of complementary goods, the fewer of them will be bought and LEFT
in price hence the less will be the demand for the good under consideration.
Decrease The lower the price of complementary goods, the higher the demand. RIGHT
in price
Income
Increase As people’s income rise, their demand for most goods will rise, such goods are called RIGHT
normal goods
Decrease There are exceptions to this general rule, however, as people get richer, they spent LEFT
less on inferior goods such as supermarket ‘value’ ranges and switch to better quality
goods
Distribution of income
If national income were redistributed from the poor to the rich, the demand for luxury goods would rise. At
the same time, as the poor get poorer they might have to buy more inferior goods; demand for these would
rise too.
Expectations of future prices changes
Increase If people think that prices are going to rise in the future, they are likely to buy more RIGHT
, now, before the prices go up
Decrease People postpone their purchases because the product will be cheaper in the future so LEFT
the demand will decrease
When the price changes the demand curve will not move, the coordinate on the curve will only move but the
curve stays on the same place.
Demand function = an equation which shows the mathematical relationship between the quantity demanded
of a good and the values of the various determinants of demand.
Regression analysis = a statistical technique which allows a functional relationship between two or more
variables to be estimated
Econometrics = the science of applying statistical techniques to economic data in order to identify and test
economic relationships.
SUMMARY
1. When the price of a good rises, the quantity demanded per period of time will fall. This is known as the
‘law of demand’. It applies both to individuals’ demand and to the whole market
2. The law of demand is explained by the income and substitution effect of a price change.
3. The relationship between price and quantity demanded per period of time can be shown in a table or
schedule or as a graph. On the graph, price is plotted on the vertical axis and quantity demanded per
period of time is on the horizontal axis. The curve resulting demand curve is downward sloping (negative
sloped)
4. Other determinants of demand include: tastes, the number and price of substitute goods, the number and
price complementary goods, income, distribution of income and expectations of future price changes
5. If price changes, the effect is shown by a movement along the demand curve. We call this effect ‘a change
in the quantity demanded’
6. If any other determinant of demand changes, the whole curve will shift. We call this effect ‘a change in
demand’ a rightward shift represents an increase in demand; a leftward shift represents a decrease in
demand
7. The relationship between the quantity demanded and the various determinants of demand (including
price) can be expressed as an equation.
Chapter 2.2 Supply
The general relationship between supply and price: when the price of a good rises, the quantity supplied will
also rise.
8.
, Chapter 6
Chapter 6.1
The cost of producing any level of output will depend on the amount of inputs used and the
price the firm must pay for them.
Short- and long-run changes in production
If a firm wants to increase production, it will take time to acquire a greater quantity of
certain inputs. If a firm wants to increase output relatively quickly, it will only be able to
increase the quantity of certain inputs, but it will have to work with its existing buildings and
machinery. A fixed factor is an input that cannot be increased within a given time period. A
variable factor is one that can.
We also distinguish short-run and long-run. Short-run is a time period during which at least
one factor of production is fixed. Output can be increased only by using more variable
factors. The long-run is a time period long enough for all inputs to be varied. The actual
length of the short- and long-run will differ.
The law of diminishing returns
Production in the short-run is subject to diminishing returns. When one or more factors are
held fixed, there will come a point beyond which the extra output from additional units of
the variable factor will diminish.
When a variable factor is added to a fixed factor, the total output that results it called the
total physical product (TPP). The relation between inputs and output is shown in a
production function. The production function gives the relationship between quantities of
physical inputs and quantities of output of goods. A firm is technically efficient when the firm
is producing as much output as is technologically possible given the quantity of factor inputs
it is using. All the points along the total physical product are technically efficient. Any point
below is technically inefficient.
In reality, total output from any given combination of inputs may be lower than the
production function indicates because of inefficient management and methods of
production. The level of production is also assumed to be constant. If there is technological
progress, the whole production function would change.
Average physical product
This is output (TPP) per unit of the variable factor. APP = TPP/Q
Marginal physical product
This is the extra output produced by employing one more unit of the variable factor. MPP =
change in TPP/change in Q