1
,Inhoudsopgave
Hoofdstuk 3 – Tabellen en grafieken.......................................................................................3
Hoofdstuk 4 centrummaten.....................................................................................................6
Hoofdstuk 5 - spreidingsmaten................................................................................................8
Hoofdstuk 8 - normale verdeling............................................................................................14
Hoofdstuk 9 - Toetsen en schatten met behulp van steekproeven........................................17
Hoofdstuk 10: Correlatie........................................................................................................27
Hoofdstuk 11 – Tijdreeksanalyse..........................................................................................30
2
,Hoofdstuk 3 – Tabellen en grafieken
Variatiebreedte is verschil tussen hoogste en laagste waarneming
1) Frequentiedichtheid bepalen
Frequentie Dichtheid Frequentiedichtheid (aantal facturen per 50 euro)
100 -< 200 20 10
200 -< 300 40 20
300 -< 350 30 30 20/ 100 x 50 = 10
350 -< 400 20 20
400 -< 600 10 2,5
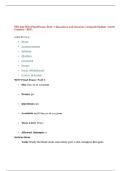
2) Histogram maken
- de staaf moet bij 0 beginnen! Hier MOET een frequentiedichtheid in verwerkt zitten.
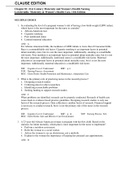
3) Frequentie polychroom
- zet een punt in het midden van de staaf, trek hier een rechte lijn tussen (begin nooit bij 0!)
3
, 4) Cumulatieve tabel
Factuurbedrag Cumulatief aantal facturen
<100 0
<200 20
<300 60
<350 90
<400 110
<600 120
- beginnen bij lager dan 100 (is altijd 0). Vervolgens plak je alles bij elkaar op. ‘
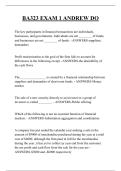
5) Cumulatieve grafiek
- deze grafiek begint altijd bij 0 en eindigt (lijkt op exponentieel) op z’n hoogst.
6) Stamdiagram
Afronden op 10tallen
110 110 540 250
530 230 280 270
310 130 180 260
160 170 260 320
430 440 340 230
🡪 Tientallen van laag naar hoog schrijven
Honderdtallen Tientallen Ook afronden op 10tallen!
1 113679
2 335668
3 1247
4 34
5 34
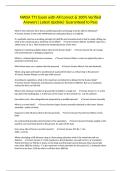
7) Interpoleren
2 vormen van interpoleren:
1. Rekenkundig interpoleren
4
,Inhoudsopgave
Hoofdstuk 3 – Tabellen en grafieken.......................................................................................3
Hoofdstuk 4 centrummaten.....................................................................................................6
Hoofdstuk 5 - spreidingsmaten................................................................................................8
Hoofdstuk 8 - normale verdeling............................................................................................14
Hoofdstuk 9 - Toetsen en schatten met behulp van steekproeven........................................17
Hoofdstuk 10: Correlatie........................................................................................................27
Hoofdstuk 11 – Tijdreeksanalyse..........................................................................................30
2
,Hoofdstuk 3 – Tabellen en grafieken
Variatiebreedte is verschil tussen hoogste en laagste waarneming
1) Frequentiedichtheid bepalen
Frequentie Dichtheid Frequentiedichtheid (aantal facturen per 50 euro)
100 -< 200 20 10
200 -< 300 40 20
300 -< 350 30 30 20/ 100 x 50 = 10
350 -< 400 20 20
400 -< 600 10 2,5
2) Histogram maken
- de staaf moet bij 0 beginnen! Hier MOET een frequentiedichtheid in verwerkt zitten.
3) Frequentie polychroom
- zet een punt in het midden van de staaf, trek hier een rechte lijn tussen (begin nooit bij 0!)
3
, 4) Cumulatieve tabel
Factuurbedrag Cumulatief aantal facturen
<100 0
<200 20
<300 60
<350 90
<400 110
<600 120
- beginnen bij lager dan 100 (is altijd 0). Vervolgens plak je alles bij elkaar op. ‘
5) Cumulatieve grafiek
- deze grafiek begint altijd bij 0 en eindigt (lijkt op exponentieel) op z’n hoogst.
6) Stamdiagram
Afronden op 10tallen
110 110 540 250
530 230 280 270
310 130 180 260
160 170 260 320
430 440 340 230
🡪 Tientallen van laag naar hoog schrijven
Honderdtallen Tientallen Ook afronden op 10tallen!
1 113679
2 335668
3 1247
4 34
5 34
7) Interpoleren
2 vormen van interpoleren:
1. Rekenkundig interpoleren
4