MATH 225N Week 4 Statistics Quiz
Week 4 quiz
Question 1
Alice sells boxes of candy at the baseball game and wants to know the mean number of boxes she sells. The
numbers for the games so far are listed below.
16,14,14,21,15
Find the mean boxes sold.
That is correct!
Answer: 16 Boxes
Question 2
Given the following list of prices (in thousands of dollars) of randomly selected trucks at a car dealership, find
the median.
20,46,19,14,42,26,33
That is correct!
Answer: median=26 thousands of dollars
Question 3
Each person in a group shuffles a deck of cards and keeps selecting a card until a queen appears. Find the
mode of the following number of cards drawn from a deck until a queen appears.
3,12,3,11,5,5,3,10,12
That is correct!
Answer: mode=3 cards
Question 4
The dataset below represents bugs found by a software tester in her product during different phases of
testing: 88, 84, 81, 94, 91, 98, 98, 200.
The measures of central tendency are given below:
Mean: 104.25; Median: 92.5; Mode: 98. Identify the outlier and the measure of central tendency that is
affected by the outlier.
, That is correct!
The outlier is 98. The mode is affected by the outlier.
The outlier is 98. The mean is affected by the outlier.
The outlier is 200. The median is affected by the outlier.
The outlier is 200. The mean is affected by the outlier.
Question 5
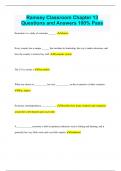
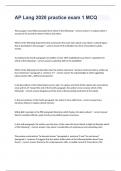
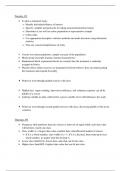
Given the following histogram, decide if the data is skewed or symmetrical.
A bar graph has a horizontal axis titled Values labeled from 2 to 18 in increments of 2 and a vertical axis titled
Frequency labeled from 0 to 200 in increments of 50. 14 bars are plotted, above the numbers 2 to 16. From
left to right, the heights of the bars are as follows: 1. 5. 10. 40, 75, 125, 190, 180, 130, 125, 60, 25,20, 10. All
values are approximate.
That is correct!
The data are skewed to the left.
The data are skewed to the right.
The data are symmetric.
Week 4 quiz
Question 1
Alice sells boxes of candy at the baseball game and wants to know the mean number of boxes she sells. The
numbers for the games so far are listed below.
16,14,14,21,15
Find the mean boxes sold.
That is correct!
Answer: 16 Boxes
Question 2
Given the following list of prices (in thousands of dollars) of randomly selected trucks at a car dealership, find
the median.
20,46,19,14,42,26,33
That is correct!
Answer: median=26 thousands of dollars
Question 3
Each person in a group shuffles a deck of cards and keeps selecting a card until a queen appears. Find the
mode of the following number of cards drawn from a deck until a queen appears.
3,12,3,11,5,5,3,10,12
That is correct!
Answer: mode=3 cards
Question 4
The dataset below represents bugs found by a software tester in her product during different phases of
testing: 88, 84, 81, 94, 91, 98, 98, 200.
The measures of central tendency are given below:
Mean: 104.25; Median: 92.5; Mode: 98. Identify the outlier and the measure of central tendency that is
affected by the outlier.
, That is correct!
The outlier is 98. The mode is affected by the outlier.
The outlier is 98. The mean is affected by the outlier.
The outlier is 200. The median is affected by the outlier.
The outlier is 200. The mean is affected by the outlier.
Question 5
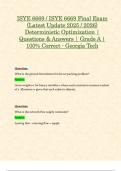
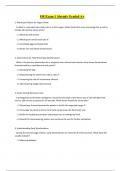
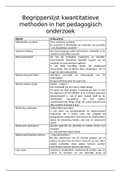
Given the following histogram, decide if the data is skewed or symmetrical.
A bar graph has a horizontal axis titled Values labeled from 2 to 18 in increments of 2 and a vertical axis titled
Frequency labeled from 0 to 200 in increments of 50. 14 bars are plotted, above the numbers 2 to 16. From
left to right, the heights of the bars are as follows: 1. 5. 10. 40, 75, 125, 190, 180, 130, 125, 60, 25,20, 10. All
values are approximate.
That is correct!
The data are skewed to the left.
The data are skewed to the right.
The data are symmetric.