Grade 11 Trigonometric Functions:
Document 2: Horizontal shifts
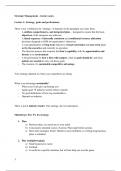
Horizontal shifts: the role of 𝑝
As you should recall from algebraic functions, the 𝑝 value causes shifts left or right:
𝑦 = 𝑎 sin(𝑥 + 𝑝) + 𝑞
𝑦 = 𝑎 cos(𝑥 + 𝑝) + 𝑞
𝑦 = 𝑎 tan(𝑥 + 𝑝) + 𝑞
We know that adding or subtracting a constant from 𝑥 in a function shifts the graph horizontally.
e.g. 𝑦 = sin(𝑥 + 30°) is obtained by shifting 𝒚 = 𝐬𝐢𝐧 𝒙 30° to the left
This is because effectively the new "ZERO" position on the x axis is where
𝑥 + 30 = 0.
i.e. where 𝑥 = − 30, hence a shift to the left.
e.g. 𝑦 = cos(𝑥 − 20°) is obtained by shifting 𝒚 = 𝐜𝐨𝐬 𝒙 20° to the right.
𝑝 > 0 The graph is shifted to the left NOTE: This is if the bracket is (𝑥 + 𝑝)
The general formula in a question could
𝑃 < 0 The graph is shifted to the right also be written as (𝑥 − 𝑝) in which case
the opposite shifts would be true for 𝑝.
1
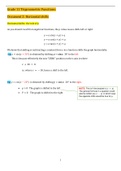
, Worked Example 1: Sketch the graphs of the following functions:
1. 𝑦 = sin(𝑥 + 30°), 𝑥 ∈ [−390°; 330°]
2. 𝑦 = tan(𝑥 − 15°), 𝑥 ∈ [−75°; 195°]
Solutions:
1. 𝑦 = sin(𝑥 + 30°), 𝑥 ∈ [−390°; 330°]
Step 1: Consider the basic shape: 𝑦 = sin 𝑥
Step 2: Consider the horizontal shift
𝑝 = 30°: This is a sin graph which is shifted 30° to the left. Think of the 5 critical points (the 3
zeros, the max and the min) each moved 30° to the left, and joined to give the new sin
graph.
Step 3: Now extend the interval for the final sketch and label all those critical points,
including the 𝑦 intercept.
Note: The 𝑦 intercept AND the coordinates of the end-points, if they are not lying on the 𝑥
axis must be shown. It can be found by substituting 𝑥 = 0 AND the lower and upper 𝑥 values
of the given interval into the given equation:
1
𝑦 intercept: 𝑦 = sin(0 + 30°) = 2
Starting point: For 𝑥 = −390°, 𝑦 = sin(−390° + 30°) = 0
Ending point: For 𝑥 = 330°, 𝑦 = sin(330° + 30°) = 0
2
Document 2: Horizontal shifts
Horizontal shifts: the role of 𝑝
As you should recall from algebraic functions, the 𝑝 value causes shifts left or right:
𝑦 = 𝑎 sin(𝑥 + 𝑝) + 𝑞
𝑦 = 𝑎 cos(𝑥 + 𝑝) + 𝑞
𝑦 = 𝑎 tan(𝑥 + 𝑝) + 𝑞
We know that adding or subtracting a constant from 𝑥 in a function shifts the graph horizontally.
e.g. 𝑦 = sin(𝑥 + 30°) is obtained by shifting 𝒚 = 𝐬𝐢𝐧 𝒙 30° to the left
This is because effectively the new "ZERO" position on the x axis is where
𝑥 + 30 = 0.
i.e. where 𝑥 = − 30, hence a shift to the left.
e.g. 𝑦 = cos(𝑥 − 20°) is obtained by shifting 𝒚 = 𝐜𝐨𝐬 𝒙 20° to the right.
𝑝 > 0 The graph is shifted to the left NOTE: This is if the bracket is (𝑥 + 𝑝)
The general formula in a question could
𝑃 < 0 The graph is shifted to the right also be written as (𝑥 − 𝑝) in which case
the opposite shifts would be true for 𝑝.
1
, Worked Example 1: Sketch the graphs of the following functions:
1. 𝑦 = sin(𝑥 + 30°), 𝑥 ∈ [−390°; 330°]
2. 𝑦 = tan(𝑥 − 15°), 𝑥 ∈ [−75°; 195°]
Solutions:
1. 𝑦 = sin(𝑥 + 30°), 𝑥 ∈ [−390°; 330°]
Step 1: Consider the basic shape: 𝑦 = sin 𝑥
Step 2: Consider the horizontal shift
𝑝 = 30°: This is a sin graph which is shifted 30° to the left. Think of the 5 critical points (the 3
zeros, the max and the min) each moved 30° to the left, and joined to give the new sin
graph.
Step 3: Now extend the interval for the final sketch and label all those critical points,
including the 𝑦 intercept.
Note: The 𝑦 intercept AND the coordinates of the end-points, if they are not lying on the 𝑥
axis must be shown. It can be found by substituting 𝑥 = 0 AND the lower and upper 𝑥 values
of the given interval into the given equation:
1
𝑦 intercept: 𝑦 = sin(0 + 30°) = 2
Starting point: For 𝑥 = −390°, 𝑦 = sin(−390° + 30°) = 0
Ending point: For 𝑥 = 330°, 𝑦 = sin(330° + 30°) = 0
2