Exam (elaborations)
Latest 2020/2021 Bloomberg Answers 8NQZRLYVD3
Rating
Sold
-
Pages
9
Grade
A+
Uploaded on
01-12-2021
Written in
2021/2022
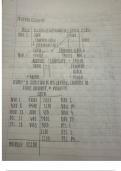
SECTION QUIZ 1. These charts show data for four countries as of early 2016. For each country, the purple line denotes historic real GDP growth. The white line denotes the consensus estimated real GDP growth. The red line denotes the most pessimistic analyst forecast. The green line denotes the most... [Show more]
Show more
Read less
Institution
University Of Massachusetts
Course
FINA 061
Whoops! We can’t load your doc right now. Try again or contact support.
Written for
- Institution
-
University Of Massachusetts
- Course
-
FINA 061
Document information
- Uploaded on
- December 1, 2021
- Number of pages
- 9
- Written in
- 2021/2022
- Type
- Exam (elaborations)
- Contains
- Questions & answers
Subjects
-
latest 20202021 bloomberg answers 8nqzrlyvd3
$13.99
Get access to the full document:
100% satisfaction guarantee
Immediately available after payment
Both online and in PDF
No strings attached