DATA SCIENCE
RESEARCH METHODS
LECTURE 1
Topics: course introduction, Scientific Method, Sample Size Determination, and ANOVA
p-value: highest significant value for which we accept H 0. If p<α → reject H 0.
Type I error α : reject H 0 when it is True.
Type II error β : accept H 0 when it is False.
The best combination of α and β is situation-specific.
One-Factor Design: Studies the impact of a single factor, Y =f ( X , ε ) for factor X on Y .
Replicated experiment: there is more than one data point at each level of the factor.
Replicates: number of rows, different values of Y .
Levels: number of columns, different levels of X .
Total outcomes: # replicates × # levels
Types of means:
Column mean: Sum of all values in the column divided by the number of replicates.
Grand mean: Sum of all data points divided by the total outcomes, RC ór sum of all column
means divided by the number of levels, C .
Least squares: optimal estimation that minimizes the sum of the squared differences.
Total Sum of Squares (TSS): sum of the squared difference between each data point and the grand mean.
Sum of Squares Between Columns (SSBc): sum of the squared difference between each column mean and
the grand mean, multiplied by R .
Sum of Squares Within Columns (SSW): sum of the squared difference between each data point in a
column and that column mean.
TSS=SS B c + SSW
If SSW ≈TSS → factor does not explain much.
If SSW /TSS ≈ 0 → factor has big influence.
MS=SSQ/df ; Mean square is the Sum of Squares divided by the degrees-of-freedom.
Unbiased estimate of population variance → use df instead of n .
E [ MSW ]=σ under constant variance assumption.
2
E [ MS Bc ]=σ 2 +V 2 with V col =[ R / ( C−1 ) ] ∙ ∑τ 2j .
E [ MS Bc ] ≠0 → true column means might not be equal, and sample error leads to difference in
column means.
F-statistic: way to find evidence of affects.
F calc >1 → evidence that V col ≠ 0 thus X affects Y . Evidence is not a final conclusion.
, F calc ≤1 → no evidence that X affects Y .
F calc ≫1 → reject H 0. Rejection means column means are different.
SLIDES LECTURE 1
Three goals of Data Science: Description, Prediction and Explanation.
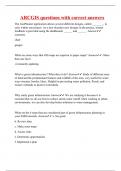
Different types of Analytics:
1. Descriptive Analytics: insight into the past
2. Predictive Analytics: understanding the future
3. Prescriptive Analytics: advice on possible outcomes
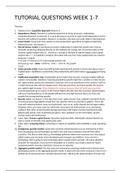
Scientific Method: has an iterative nature.
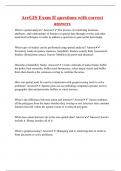
Six Sigma: disciplined, data-driven methodology for process
improvement. Uses DMAIC cycle.
Key Insights:
Identify the three data science goals.
Scientific method is an iterative process.
Not planning an experiment will not result in the wanted outcomes.
Experiment can have more factors, that can have more than 2 levels.
Six Sigma incorporated several aspects of the scientific method.
X−μ 0
Normal distribution gives test statistic T = if σ is known. Reject if |T |> z α / 2 or P H (|T|>|T 0|) <α .
σ /√ n 0
(
Confidence interval: reject if it doesn’t fall in the interval, x−z α /2
σ
√n
, x + z α /2
σ
√n ) .
Minimal sample sizes:
Normal distribution:
( )
2
z α /2 σ
o ONE SAMPLE CASE: if σ is known → n ≥ with E maximal absolute error.
E
o ONE SAMPLE CASE: if σ is unknown → same as with known but use worst case σ .
Round up to strictly satisfy the inequality.
( ) (σ + σ )
2
z α /2 2 2
o TWO SAMPLE CASE: equal sample sizes and variances known→ n ≥ 1 2
E
Binomial distribution:
( )
2
zα/ 2
o ONE SAMPLE CASE: n ≥ ^p (1−^p )use worst case ^p or upper/lower bound
E
Analyze p → p ( 1− p ) on [ 0,1 ]
( )
2
z
o TWO SAMPLE CASE: equal sample sizes n ≥ α/ 2 ( ^ p 1 ( 1− ^
p 1) + ^ p 2) )
p 2 ( 1− ^
E
Power analysis:
Normal distribution H 0 : μ=μ0 :
o (
β=Φ z α / 2−
δ √n
σ ) (
−Φ −z α /2 −
δ √n
σ )
( )
2 2
δ √n (z +z ) σ
o Φ −z α/ 2− small compared to β → n ≈ α/ 2 β
σ δ
2
RESEARCH METHODS
LECTURE 1
Topics: course introduction, Scientific Method, Sample Size Determination, and ANOVA
p-value: highest significant value for which we accept H 0. If p<α → reject H 0.
Type I error α : reject H 0 when it is True.
Type II error β : accept H 0 when it is False.
The best combination of α and β is situation-specific.
One-Factor Design: Studies the impact of a single factor, Y =f ( X , ε ) for factor X on Y .
Replicated experiment: there is more than one data point at each level of the factor.
Replicates: number of rows, different values of Y .
Levels: number of columns, different levels of X .
Total outcomes: # replicates × # levels
Types of means:
Column mean: Sum of all values in the column divided by the number of replicates.
Grand mean: Sum of all data points divided by the total outcomes, RC ór sum of all column
means divided by the number of levels, C .
Least squares: optimal estimation that minimizes the sum of the squared differences.
Total Sum of Squares (TSS): sum of the squared difference between each data point and the grand mean.
Sum of Squares Between Columns (SSBc): sum of the squared difference between each column mean and
the grand mean, multiplied by R .
Sum of Squares Within Columns (SSW): sum of the squared difference between each data point in a
column and that column mean.
TSS=SS B c + SSW
If SSW ≈TSS → factor does not explain much.
If SSW /TSS ≈ 0 → factor has big influence.
MS=SSQ/df ; Mean square is the Sum of Squares divided by the degrees-of-freedom.
Unbiased estimate of population variance → use df instead of n .
E [ MSW ]=σ under constant variance assumption.
2
E [ MS Bc ]=σ 2 +V 2 with V col =[ R / ( C−1 ) ] ∙ ∑τ 2j .
E [ MS Bc ] ≠0 → true column means might not be equal, and sample error leads to difference in
column means.
F-statistic: way to find evidence of affects.
F calc >1 → evidence that V col ≠ 0 thus X affects Y . Evidence is not a final conclusion.
, F calc ≤1 → no evidence that X affects Y .
F calc ≫1 → reject H 0. Rejection means column means are different.
SLIDES LECTURE 1
Three goals of Data Science: Description, Prediction and Explanation.
Different types of Analytics:
1. Descriptive Analytics: insight into the past
2. Predictive Analytics: understanding the future
3. Prescriptive Analytics: advice on possible outcomes
Scientific Method: has an iterative nature.
Six Sigma: disciplined, data-driven methodology for process
improvement. Uses DMAIC cycle.
Key Insights:
Identify the three data science goals.
Scientific method is an iterative process.
Not planning an experiment will not result in the wanted outcomes.
Experiment can have more factors, that can have more than 2 levels.
Six Sigma incorporated several aspects of the scientific method.
X−μ 0
Normal distribution gives test statistic T = if σ is known. Reject if |T |> z α / 2 or P H (|T|>|T 0|) <α .
σ /√ n 0
(
Confidence interval: reject if it doesn’t fall in the interval, x−z α /2
σ
√n
, x + z α /2
σ
√n ) .
Minimal sample sizes:
Normal distribution:
( )
2
z α /2 σ
o ONE SAMPLE CASE: if σ is known → n ≥ with E maximal absolute error.
E
o ONE SAMPLE CASE: if σ is unknown → same as with known but use worst case σ .
Round up to strictly satisfy the inequality.
( ) (σ + σ )
2
z α /2 2 2
o TWO SAMPLE CASE: equal sample sizes and variances known→ n ≥ 1 2
E
Binomial distribution:
( )
2
zα/ 2
o ONE SAMPLE CASE: n ≥ ^p (1−^p )use worst case ^p or upper/lower bound
E
Analyze p → p ( 1− p ) on [ 0,1 ]
( )
2
z
o TWO SAMPLE CASE: equal sample sizes n ≥ α/ 2 ( ^ p 1 ( 1− ^
p 1) + ^ p 2) )
p 2 ( 1− ^
E
Power analysis:
Normal distribution H 0 : μ=μ0 :
o (
β=Φ z α / 2−
δ √n
σ ) (
−Φ −z α /2 −
δ √n
σ )
( )
2 2
δ √n (z +z ) σ
o Φ −z α/ 2− small compared to β → n ≈ α/ 2 β
σ δ
2