ECONOMIC OVERVIEW OF
THE U.S.A
Macro-Economics
Student ID: 522341nk
Student Name: Nadia Klomp
,1a)
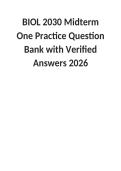
There have been developments of the GDP over the past 7 years throughout Barack Obama’s
and Donald Trumps’ administrations. Clear differences in patterns and trends can be
identified between the two presidents terms. With Obama’s term demonstrating volatile
changes in quarterly GDP figures from falling as low as -1.1% to rising up to 5.5%
(Statista,2020). This certain sudden increase occurred consecutively after each other within
the same year. This therefore can demonstrate a potential unstable economy period under
Obama’s administration in comparison to the numbers of the past few years with a range of
only 2.4∆ . However this is ignoring the last abrupt decrease in GDP from 2020’s first quarter
whereby it dropped to a record low of -5.5% (Statista, 2020) which is closely competing to
the 2008 economic crisis where during the 4 th quarter a drop of -6.3% occurred (The balance,
2018). This percentage evolved due to the current epidemic of the covid-19 which has
impacted economies world-wide. Such events, whether they are environmental or political
can heavily impact the GDP of a country. Therefore a possible explanation for the volatile
changes in GDP during Obama’s term can be explained due to the previous world economic
crisis in 2008 which left several major economies burdened with barely payable debts and
high unemployment rates, including the USA. The aftermath of this crisis can be seen in the
unstable GDP afterwards however the explanation for the greatest decline which was in 2014
is largely being contributed to the horrible weather conditions from the last quarter of 2013.
As great blizzards caused restaurants and all commercial stores to be closed and it may have
slowed down shipments both domestically and abroad creating a reduced quantity of export
(CNN.com, 2014). Which finally was able to recover in 2016 throughout Obama’s
administration and taken over by Trump to further gradually increase until COVID-19.
1b)
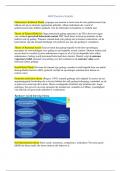
Changes in composition of the GDP over the last 7 years can be largely impacted by
governmental spending. This governmental spending is provided and permitted by the
Federal reserve which can aid in progressing the American economy. This was exactly done
by previous president Barack Obama where the Fed kept its interest rate near zero and
purchased trillions of dollars in bonds to allow for quantitative easing throughout 2009-2014
(CNN,2019). This allowed for gradual improvement of the economy, however only around
2015 they able to increase rates and for a second time in December 2016 (CNN,2019). The
positive impact of this governmental spending can be seen in the long run as a multiplier
effect allowed for an average annual increased GDP growth of 2.4% in 2013 till 2015
(countryeconomy.com, 2015). This further increased up to an average of 2.5% in the first
three years of Trumps administration as there was also a dramatic decrease in governmental
spending. Furthermore, the effect of Trumps decision of enacting a trade war against China
back in 2018 has so far not hugely impacted the US market however there was indeed a short
period fall in the last quarter of 2018 causing USA’s GDP to ease down to 1.1% (Statista,
2020). Experts also predicted a decrease of 0.23% of GDP in the long run due to the current
tariffs imposed by Trumps administration and if they were to further impose the additional
tariffs it could further reduce GDP by 0.24% (tax foundation, 2020).
, 1c)
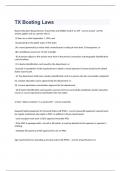
The trade balance within the USA is clearly demonstrating a trade deficit as its imports
greatly surpass that of their exports. The U.S. trade deficit has been gradually increasing
since 2009 after a sudden drop from 708.73 billion to 383.77 billion after the 2008 economic
crisis. (Statista, 2019) The percentage growth of the trade deficit throughout Obama’s second
term and that of Trumps’ has had none explicit changes other than having an overall average
trade deficit of 497.32 billion during 2012-2015 and 574.14 billion throughout 2016-2019
(Statista, 2019). However the effect of the trade war against China by Trumps administration
can clearly be seen as there was a drop of 87 billion dollars in imports from China to the US
and an overall 10.8 billion decrease in trade deficit for 2019 (U.S census Bureau, 2020).
Additionally, due to the coronavirus there has been an increase in deficit of 11.6% building
up in 44.4 billion dollars within the last few months alone (Bea, 2020). This is mainly due to
businesses not being able to work at full capacity and having restricted travel as borders are
closed.
1d)
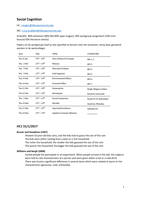
Over the last 7 years the U.S. has created an outstanding debt of up to a current number of
22.7 trillion U.S. dollars in 2019. This has caused the U.S. to rank at 13 th position with the
highest public debt in relation to GDP (Duffin, 2020). The debt limit (debt ceiling) is the total
amount U.S. government may authorize to lend money for social obligations such as
healthcare, military salaries etc. This debt ceiling has been acted on by congress 78 separate
occasions to raise and extend the debt limit since 1960 (U.S. department of the
treasury,2020). With more drastic raises after crisis’s like the bank crisis in 2008, followed by
a more stable period with relatively lower rises during the remaining years under Obama.
However this increase in the U.S. budget deficit has continued in the past few years with
Trumps decision of tax cuts in 2017. Causing a steeper rise of the debt ceiling in 2017 and
2018. This has brought some discussion within congress on what should be done as “there
was a time when republicans insisted on a dollar of spending cuts for every dollar increase in
the debt limit” (financial times, 2019). However the debt ceiling will continue to rise and be
altered in order to prevent a default from happening whereby U.S. treasury cannot issue any
more treasury bonds and will undermine its ability to pay bills, forced to choose between
paying federal employee salaries, social security benefits or interest on national debt.
THE U.S.A
Macro-Economics
Student ID: 522341nk
Student Name: Nadia Klomp
,1a)
There have been developments of the GDP over the past 7 years throughout Barack Obama’s
and Donald Trumps’ administrations. Clear differences in patterns and trends can be
identified between the two presidents terms. With Obama’s term demonstrating volatile
changes in quarterly GDP figures from falling as low as -1.1% to rising up to 5.5%
(Statista,2020). This certain sudden increase occurred consecutively after each other within
the same year. This therefore can demonstrate a potential unstable economy period under
Obama’s administration in comparison to the numbers of the past few years with a range of
only 2.4∆ . However this is ignoring the last abrupt decrease in GDP from 2020’s first quarter
whereby it dropped to a record low of -5.5% (Statista, 2020) which is closely competing to
the 2008 economic crisis where during the 4 th quarter a drop of -6.3% occurred (The balance,
2018). This percentage evolved due to the current epidemic of the covid-19 which has
impacted economies world-wide. Such events, whether they are environmental or political
can heavily impact the GDP of a country. Therefore a possible explanation for the volatile
changes in GDP during Obama’s term can be explained due to the previous world economic
crisis in 2008 which left several major economies burdened with barely payable debts and
high unemployment rates, including the USA. The aftermath of this crisis can be seen in the
unstable GDP afterwards however the explanation for the greatest decline which was in 2014
is largely being contributed to the horrible weather conditions from the last quarter of 2013.
As great blizzards caused restaurants and all commercial stores to be closed and it may have
slowed down shipments both domestically and abroad creating a reduced quantity of export
(CNN.com, 2014). Which finally was able to recover in 2016 throughout Obama’s
administration and taken over by Trump to further gradually increase until COVID-19.
1b)
Changes in composition of the GDP over the last 7 years can be largely impacted by
governmental spending. This governmental spending is provided and permitted by the
Federal reserve which can aid in progressing the American economy. This was exactly done
by previous president Barack Obama where the Fed kept its interest rate near zero and
purchased trillions of dollars in bonds to allow for quantitative easing throughout 2009-2014
(CNN,2019). This allowed for gradual improvement of the economy, however only around
2015 they able to increase rates and for a second time in December 2016 (CNN,2019). The
positive impact of this governmental spending can be seen in the long run as a multiplier
effect allowed for an average annual increased GDP growth of 2.4% in 2013 till 2015
(countryeconomy.com, 2015). This further increased up to an average of 2.5% in the first
three years of Trumps administration as there was also a dramatic decrease in governmental
spending. Furthermore, the effect of Trumps decision of enacting a trade war against China
back in 2018 has so far not hugely impacted the US market however there was indeed a short
period fall in the last quarter of 2018 causing USA’s GDP to ease down to 1.1% (Statista,
2020). Experts also predicted a decrease of 0.23% of GDP in the long run due to the current
tariffs imposed by Trumps administration and if they were to further impose the additional
tariffs it could further reduce GDP by 0.24% (tax foundation, 2020).
, 1c)
The trade balance within the USA is clearly demonstrating a trade deficit as its imports
greatly surpass that of their exports. The U.S. trade deficit has been gradually increasing
since 2009 after a sudden drop from 708.73 billion to 383.77 billion after the 2008 economic
crisis. (Statista, 2019) The percentage growth of the trade deficit throughout Obama’s second
term and that of Trumps’ has had none explicit changes other than having an overall average
trade deficit of 497.32 billion during 2012-2015 and 574.14 billion throughout 2016-2019
(Statista, 2019). However the effect of the trade war against China by Trumps administration
can clearly be seen as there was a drop of 87 billion dollars in imports from China to the US
and an overall 10.8 billion decrease in trade deficit for 2019 (U.S census Bureau, 2020).
Additionally, due to the coronavirus there has been an increase in deficit of 11.6% building
up in 44.4 billion dollars within the last few months alone (Bea, 2020). This is mainly due to
businesses not being able to work at full capacity and having restricted travel as borders are
closed.
1d)
Over the last 7 years the U.S. has created an outstanding debt of up to a current number of
22.7 trillion U.S. dollars in 2019. This has caused the U.S. to rank at 13 th position with the
highest public debt in relation to GDP (Duffin, 2020). The debt limit (debt ceiling) is the total
amount U.S. government may authorize to lend money for social obligations such as
healthcare, military salaries etc. This debt ceiling has been acted on by congress 78 separate
occasions to raise and extend the debt limit since 1960 (U.S. department of the
treasury,2020). With more drastic raises after crisis’s like the bank crisis in 2008, followed by
a more stable period with relatively lower rises during the remaining years under Obama.
However this increase in the U.S. budget deficit has continued in the past few years with
Trumps decision of tax cuts in 2017. Causing a steeper rise of the debt ceiling in 2017 and
2018. This has brought some discussion within congress on what should be done as “there
was a time when republicans insisted on a dollar of spending cuts for every dollar increase in
the debt limit” (financial times, 2019). However the debt ceiling will continue to rise and be
altered in order to prevent a default from happening whereby U.S. treasury cannot issue any
more treasury bonds and will undermine its ability to pay bills, forced to choose between
paying federal employee salaries, social security benefits or interest on national debt.