MATH 225N Week 8 Assignment; Correlation and Causation
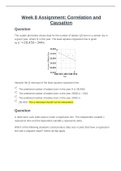
1. Question: The scatter plot below shows data for the number of babies (y) born in a certain city in a given year, where x is the year. The least squares regression line is given by yˆ=28,450−344x. Interpret the y-intercept of the least squares regression line. 2. Question: A retail store uses sales data to make a regression line. The independent variable x represents time and the dependent variable y represents sales. Which of the following situations could produce data sets or plots that have a regression line with a negative slope? Select all that apply. 3. Question: A business finds that sales increase when the outdoor temperature decreases. Identify the relation between sales and temperature 4. Question: True or False: The more mangoes you eat, the more rashes you get. 5. Question: Suppose that data collected from police reports of motor vehicle crashes show a moderate positive correlation between the speed of the motor vehicle at the time of the crash and the severity of injuries to the driver. Answer the following question based only on this information. True or false: It can be concluded that the faster a motor vehicle is traveling at the time of a crash, the more severe the injuries to the driver are. 6. Question: Suppose that a large controlled experiment tests whether caffeine improves reaction times. A very large number of randomly selected participants are randomly given identical-seeming pills with varying doses of caffeine (including none) and then given tests of reaction times under the same conditions. The experiment finds a strong negative correlation between caffeine dose and reaction time. (Note that lower reaction times are better.) Identify what can be concluded based on this information. 7. Question: Which of the following situations could have a regression line with a negative y- intercept? 8. Question: Which of the following situations could produce data sets or plots that could have a regression line with a negative y-intercept? Select all that apply.
Written for
Document information
- Uploaded on
- October 18, 2021
- Number of pages
- 5
- Written in
- 2021/2022
- Type
- Other
- Person
- Unknown
Subjects
-
math 225n week 8 assignment correlation and causation
-
math 225n correlation and causation
-
math 225n assignment correlation and causation
-
math 225n week 8 assignment
-
math 225n assignment week 8
Also available in package deal