Samenvatting Statistiek W1 & W2
1
,Week 1
Introductie
0.2: Statistische concepten
Nominal: Gender football players; city where they come from
Ordinal: Uitslag voetbalcompetitie
Interval: Leeftijd
Ratio: Lichaamslengte, gewicht
1: Beschrijvende statistieken
1.1: Data beschrijven
Tabellen
2
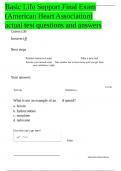
,Ordenen cases en variabelen:
→ deze laat je meestal niet zien want erg groot bestand → Frequency table maak je om het dan te
laten zien.
→ kan dus ook met Quantative variabele.
3
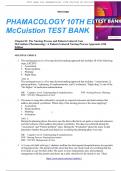
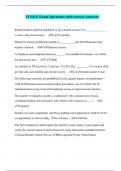
, Grafieken
Frequency tables → graphs
Als je veel categorieën hebt → bar graph
Dit waren categoriale, hoe doen we dat bij quantatieve? → dotplot
4
1
,Week 1
Introductie
0.2: Statistische concepten
Nominal: Gender football players; city where they come from
Ordinal: Uitslag voetbalcompetitie
Interval: Leeftijd
Ratio: Lichaamslengte, gewicht
1: Beschrijvende statistieken
1.1: Data beschrijven
Tabellen
2
,Ordenen cases en variabelen:
→ deze laat je meestal niet zien want erg groot bestand → Frequency table maak je om het dan te
laten zien.
→ kan dus ook met Quantative variabele.
3
, Grafieken
Frequency tables → graphs
Als je veel categorieën hebt → bar graph
Dit waren categoriale, hoe doen we dat bij quantatieve? → dotplot
4