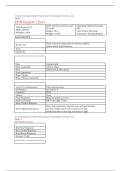
Leary – introduction to behavioural research methods – chapter 2
A schema → a cognitive generalization that organizes and guides the processing of information. For
example, schemas of big cities many times include generalizations such as ‘’crowded and dangerous’’
or ‘’interesting and exciting’’.
Behavioural variability is about how and why behaviour varies across situations, differs among
individuals and changes over time.
5 ways in which variability is central to the research process:
Psychology and other behavioural sciences involve the study of behavioural variability.
Understanding behaviour and mental processes really means understanding what makes
behaviour, thought and emotion vary.
Behaviour varies across:
o Situations;
o individuals;
o time.
Research questions in all behavioural sciences are questions about behavioural variability.
This happens both consciously and unconsciously.
Research should be designed in a manner that best allows the researcher to answer
questions about behavioural variability. Research studies must be designed in a way that
allows us to identify factors related to the behavioural variability we observe.
The measurement of behaviour involves the assessment of behavioural variability. We would
like the variability in the numbers we assign to various participants to correspond to the actual
variability in participant’s behaviour, thoughts, emotions or physiological reactions.
Statistical analyses are used to describe and account for the observed variability in the
behavioural data. We need statistics to understand behavioural variability and to answer
questions about the variability in data.
Statistics serve 2 general purposes for researchers:
Descriptive statistics are used to summarize and describe the behaviour of participants in a
study.
Inferential statistics are used to draw conclusions about the reliability and generalizability of
one’s findings.
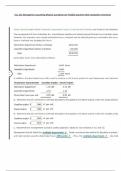
The statistic ‘’variance’’ is used to indicate the amount of observed variability in participants’
behaviour. Possibilities to indicate variance:
The range → to subtract the smallest from the largest score above. The limitation here is that
the range does not say anything about the scores between the smallest and largest.
The mean → also known as the average, the sum of a set of scores divided by the number of
scores you have. This is a useful method. If most of the scores are tightly clustered around the
mean, the variance of the data is small. If the scores are more spread out, the variance of the
data is big(ger).
5 septs for seeing what variance is:
1) Calculate the mean of your data. Sum the numbers and divide by the number of scores you
have. The symbols, ӯ, x en M.
2) Calculate the deviation score by subtracting the mean from each score.
3) Note that a positive deviation scire indicates that the person’s score fell above the mean and a
negative number indicates a score below the mean. We need to get rid of negative numbers
by squaring each of the deviation scores.
4) Add al the squared deviation scores. This is called the total sum of the squares.
5) Because we do not want our index of variability to be affected by the size of the sample, we
divide the sum of squares by a function of the number of participants in our sample. We
usually divide by one less than the number of participants. This gives us the variance of our
data, which is indicated by the symbol s².
Statistical notation
The sigma, Σ, is the symbol for summation. N is the number of participants. Y i is the symbol for each
individual participant’s score.
A schema → a cognitive generalization that organizes and guides the processing of information. For
example, schemas of big cities many times include generalizations such as ‘’crowded and dangerous’’
or ‘’interesting and exciting’’.
Behavioural variability is about how and why behaviour varies across situations, differs among
individuals and changes over time.
5 ways in which variability is central to the research process:
Psychology and other behavioural sciences involve the study of behavioural variability.
Understanding behaviour and mental processes really means understanding what makes
behaviour, thought and emotion vary.
Behaviour varies across:
o Situations;
o individuals;
o time.
Research questions in all behavioural sciences are questions about behavioural variability.
This happens both consciously and unconsciously.
Research should be designed in a manner that best allows the researcher to answer
questions about behavioural variability. Research studies must be designed in a way that
allows us to identify factors related to the behavioural variability we observe.
The measurement of behaviour involves the assessment of behavioural variability. We would
like the variability in the numbers we assign to various participants to correspond to the actual
variability in participant’s behaviour, thoughts, emotions or physiological reactions.
Statistical analyses are used to describe and account for the observed variability in the
behavioural data. We need statistics to understand behavioural variability and to answer
questions about the variability in data.
Statistics serve 2 general purposes for researchers:
Descriptive statistics are used to summarize and describe the behaviour of participants in a
study.
Inferential statistics are used to draw conclusions about the reliability and generalizability of
one’s findings.
The statistic ‘’variance’’ is used to indicate the amount of observed variability in participants’
behaviour. Possibilities to indicate variance:
The range → to subtract the smallest from the largest score above. The limitation here is that
the range does not say anything about the scores between the smallest and largest.
The mean → also known as the average, the sum of a set of scores divided by the number of
scores you have. This is a useful method. If most of the scores are tightly clustered around the
mean, the variance of the data is small. If the scores are more spread out, the variance of the
data is big(ger).
5 septs for seeing what variance is:
1) Calculate the mean of your data. Sum the numbers and divide by the number of scores you
have. The symbols, ӯ, x en M.
2) Calculate the deviation score by subtracting the mean from each score.
3) Note that a positive deviation scire indicates that the person’s score fell above the mean and a
negative number indicates a score below the mean. We need to get rid of negative numbers
by squaring each of the deviation scores.
4) Add al the squared deviation scores. This is called the total sum of the squares.
5) Because we do not want our index of variability to be affected by the size of the sample, we
divide the sum of squares by a function of the number of participants in our sample. We
usually divide by one less than the number of participants. This gives us the variance of our
data, which is indicated by the symbol s².
Statistical notation
The sigma, Σ, is the symbol for summation. N is the number of participants. Y i is the symbol for each
individual participant’s score.