Management Research Methods 1
Week 1 – Data
What is data?
Data has a fixed structure
o It consists of a number of properties (variables) each column represents
one variable
o Measured from a set of things/people/etc (units) each row represents one
unit
o The (experimental or observational) unit here is a Case
o For each unit (case) we have measured several variables
Levels of measurement
Categorical (entitles are divided into distinct categories):
o Binary variable (two outcomes), e.g. dead or alive
o Nominal variable, e.g. whether someone is an omnivore, vegetarian or vegan
o Ordinal variable, e.g. bad, intermediate, good
Numerical:
o Discrete data (counts), e.g.: number of defects geen getallen zoals 8,3. Het
is een absoluut getal
o Continious (entitles get a distinct score), e.g. temperature, body length kan
dus wel 8,3 zijn
Variables can be converted to a lower level of measurement. For
example, from
Body length =< 160 cm small
Body length > 160 cm and < 180 cm medium
Body length >= 180 cm tall
This implies a loss of information. It is not reversible
For example, if you know that “body length = medium”, the exact
amount of cm’s cannot be retrieved
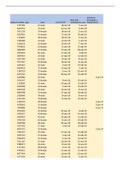
, o Case number= nominal, sender-id= nominal, type= nominal, time=
continuous, pending iterations= discrete data
Data collection
In qualitative research, you need to motivate and document the way you collected
data
Is the sample representative?
o Generalize findings in a sample to an entire population
Measure firm’s revenue for 3 weeks, generalize to the full 52 weeks
if you measure in October, it’s not valid for July
Measure outside temperature for 5 days, generalize to the entire
month if you measure September, it’s not valid for the whole year
Ask 1000 people who they will vote on at the elections, predict
outcome of entire country if you ask only a specific group, it’s not
representative for the outcome of the election
o Statistics only gives conclusions about the population you have sampled from
o Questions to ask:
What is the population? How to make my sample representative for
that population?
Usually random sampling:
Assign numbers to all units in the population,
Let a computer draw randomly 30 numbers,
Include these observations in your sample
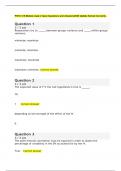
Is the data valid?
o Validity= do the data reflect what they should reflect? And can they be used
to answer the research question?
Data should be checked for errors and mistakes (face validity check)
Multiple people involved in measurement: did everybody know the
measurement procedure?
Were there other problems / irregularities during measurement?
Is there measurement error?
, o The discrepancy between the actual value we are trying to measure, and the
number we use to represent that value
Example: You (in reality) weigh 80 kg. According to your bathroom
scale, you weigh 83 kg. The measurement error is 3 kg.
o There are two types of measurement error: systematic and random
1) Systematic measurement error
o Difference between the average measurement result and the true value
o Consistent errors, it’s consistency off of the centre
o Happens in every case you measure
NMI calibrates pumps at gas stations at a yearly basis
Non-digital bathroom scales can be calibrated
Clocks on mobile phones are regularly synchronized with online time
servers
2) Random measurement error
o Unsystematic deviations due to imprecision of the measurement system
For ice skating at the winter Olympics, multiple time measurements
systems are used to decide who is the winner
Ever asked two people to measure your length?
o We have reference material at our disposal that has a ‘true’ value of 5.0
o Measuring device 1 produces the following outcomes: 3.8, 4.4, 4.2, 4.0
o Measuring device 2 produces the following outcomes: 6.5, 4.0, 3.2, 6.3
o Questions:
- Which method has the largest bias? device 1 (systematic)
- Which one has the largest measurement spread? device 2 (random)
- Which method do you prefer? Why? Device 1, je kunt deze kalibreren,
zodat de fout gecorrigeerd wordt. Device 2 kan je niet corrigeren als er
teveel fouten zijn.
Example: lifting weights
You want to test who is the strongest. You decide to measure strength by the
maximum weight a person can lift.
Will this give you reliable information to decide who is strongest? Probably not
Example: train delays
Claim: the Dutch railway company (NS) has a delay percentage of 14%
Ligt eraan wat je ziet als vertraging. NS en ProRail hebben beide andere methodes
om het te meten. Sommige zien 3 minuten als vertraging, sommige zien 5 minuten
als vertraging.
Unit: departures? Arrivals? Trains?
Measurement procedure: at which stations? Stopwatch or database? When (one day,
one year)?
Data analysis
Describing data
, You usually do not recite an entire dataset when someone asks you what is in it
you summarize is in a few numbers (highlights)
Location
o Median (= the middle score when data is ordered)
Median = 98
This means: 50% from the results is below 98 and 50% from the results
are above 98
It doesn’t matter how high the minimum or maximum is
o Mean (= the sum of the data divided by the amount of data)
N = total number of cases (11)
o Which one is more representative? The median for an indication for the
salary and the mean for the financial controller
o Mode (=most frequent number)
Dispersion (spread)
o Range (=the smallest value subtracted from the largest)
The highest value is 234 and the lowest is 22. Rang= 212
Note: very sensitive to outliers
o Interquartile range (the range of the middle 50% of the data)
Data verdelen in stukken van 25%, mediaan in het midden
Interquartile range= the difference between the lower quartile and the
upper quartile (50%)
Week 1 – Data
What is data?
Data has a fixed structure
o It consists of a number of properties (variables) each column represents
one variable
o Measured from a set of things/people/etc (units) each row represents one
unit
o The (experimental or observational) unit here is a Case
o For each unit (case) we have measured several variables
Levels of measurement
Categorical (entitles are divided into distinct categories):
o Binary variable (two outcomes), e.g. dead or alive
o Nominal variable, e.g. whether someone is an omnivore, vegetarian or vegan
o Ordinal variable, e.g. bad, intermediate, good
Numerical:
o Discrete data (counts), e.g.: number of defects geen getallen zoals 8,3. Het
is een absoluut getal
o Continious (entitles get a distinct score), e.g. temperature, body length kan
dus wel 8,3 zijn
Variables can be converted to a lower level of measurement. For
example, from
Body length =< 160 cm small
Body length > 160 cm and < 180 cm medium
Body length >= 180 cm tall
This implies a loss of information. It is not reversible
For example, if you know that “body length = medium”, the exact
amount of cm’s cannot be retrieved
, o Case number= nominal, sender-id= nominal, type= nominal, time=
continuous, pending iterations= discrete data
Data collection
In qualitative research, you need to motivate and document the way you collected
data
Is the sample representative?
o Generalize findings in a sample to an entire population
Measure firm’s revenue for 3 weeks, generalize to the full 52 weeks
if you measure in October, it’s not valid for July
Measure outside temperature for 5 days, generalize to the entire
month if you measure September, it’s not valid for the whole year
Ask 1000 people who they will vote on at the elections, predict
outcome of entire country if you ask only a specific group, it’s not
representative for the outcome of the election
o Statistics only gives conclusions about the population you have sampled from
o Questions to ask:
What is the population? How to make my sample representative for
that population?
Usually random sampling:
Assign numbers to all units in the population,
Let a computer draw randomly 30 numbers,
Include these observations in your sample
Is the data valid?
o Validity= do the data reflect what they should reflect? And can they be used
to answer the research question?
Data should be checked for errors and mistakes (face validity check)
Multiple people involved in measurement: did everybody know the
measurement procedure?
Were there other problems / irregularities during measurement?
Is there measurement error?
, o The discrepancy between the actual value we are trying to measure, and the
number we use to represent that value
Example: You (in reality) weigh 80 kg. According to your bathroom
scale, you weigh 83 kg. The measurement error is 3 kg.
o There are two types of measurement error: systematic and random
1) Systematic measurement error
o Difference between the average measurement result and the true value
o Consistent errors, it’s consistency off of the centre
o Happens in every case you measure
NMI calibrates pumps at gas stations at a yearly basis
Non-digital bathroom scales can be calibrated
Clocks on mobile phones are regularly synchronized with online time
servers
2) Random measurement error
o Unsystematic deviations due to imprecision of the measurement system
For ice skating at the winter Olympics, multiple time measurements
systems are used to decide who is the winner
Ever asked two people to measure your length?
o We have reference material at our disposal that has a ‘true’ value of 5.0
o Measuring device 1 produces the following outcomes: 3.8, 4.4, 4.2, 4.0
o Measuring device 2 produces the following outcomes: 6.5, 4.0, 3.2, 6.3
o Questions:
- Which method has the largest bias? device 1 (systematic)
- Which one has the largest measurement spread? device 2 (random)
- Which method do you prefer? Why? Device 1, je kunt deze kalibreren,
zodat de fout gecorrigeerd wordt. Device 2 kan je niet corrigeren als er
teveel fouten zijn.
Example: lifting weights
You want to test who is the strongest. You decide to measure strength by the
maximum weight a person can lift.
Will this give you reliable information to decide who is strongest? Probably not
Example: train delays
Claim: the Dutch railway company (NS) has a delay percentage of 14%
Ligt eraan wat je ziet als vertraging. NS en ProRail hebben beide andere methodes
om het te meten. Sommige zien 3 minuten als vertraging, sommige zien 5 minuten
als vertraging.
Unit: departures? Arrivals? Trains?
Measurement procedure: at which stations? Stopwatch or database? When (one day,
one year)?
Data analysis
Describing data
, You usually do not recite an entire dataset when someone asks you what is in it
you summarize is in a few numbers (highlights)
Location
o Median (= the middle score when data is ordered)
Median = 98
This means: 50% from the results is below 98 and 50% from the results
are above 98
It doesn’t matter how high the minimum or maximum is
o Mean (= the sum of the data divided by the amount of data)
N = total number of cases (11)
o Which one is more representative? The median for an indication for the
salary and the mean for the financial controller
o Mode (=most frequent number)
Dispersion (spread)
o Range (=the smallest value subtracted from the largest)
The highest value is 234 and the lowest is 22. Rang= 212
Note: very sensitive to outliers
o Interquartile range (the range of the middle 50% of the data)
Data verdelen in stukken van 25%, mediaan in het midden
Interquartile range= the difference between the lower quartile and the
upper quartile (50%)