OPMT 1197
Business Statistics
Lectures 17-18: The Different Hypothesis Tests
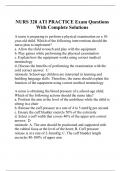
Hypothesis Test Null, Alternate Hyp Rejection Region Critical Value P-value
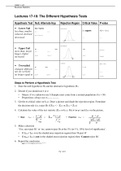
Lower Tail Mean Proportion In the lower tail
Zcrit negative P(Z < −Ztest)
less than, smaller H0:μ=▒ H0: p = ▒
reduced, declined HA: μ < ▒ HA: p < ▒
decreased * tcrit if t * ttest if t
α
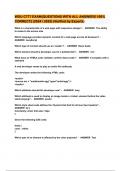
In the upper tail
Upper Tail Means Proportion Zcrit positive
P(Z > Ztest)
more than, larger H0:μ=▒ H0: p = ▒
bigger, higher HA:μ>▒ HA: p > ▒ * tcrit if t
increased * ttest if t
α
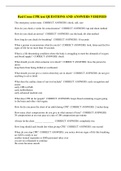
In both tails
2P(Z < −Ztest)
Two-tailed Mean Proportion Zcrit both ±
changed, different H0:μ=▒ H0: p = ▒
or
not set correctly 2P(Z > +Ztest)
no longer equal to HA:μ≠▒ HA: p ≠ ▒ * tcrit if t
* ttest if t
α/2 α/2
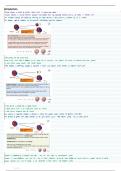
Steps to Perform a Hypothesis Test
1. State the null hypothesis H0 and the alternative hypothesis HA
2. Decide if you should use t or z
• Means: if σ is unknown use t (Sample must come from a normal population if n < 30)
• Proportions: always use z (Both np and n(1 – p) must be at least 5)
3. Get the z-critical value (or tcrit). Draw a picture and shade the rejection region. Formulate
the decision rule (i.e. reject H0 if ztest < – zcrit or ztest > zcrit)
4. Calculate the value of the test statistic (ztest or ttest). Put x (or p ) and ztest on the picture.
x−µ p −p
▪ Mean: ztest =
σ
or ttest = xs− µ ▪ Proportion: ztest =
p(1 − p)
n n n
5. Make a decision
‘Yes, can reject H0’ or ‘no, cannot reject H0 at the 5% (or 1%, 10%) level of significance’.
• If ztest / ttest is in the shaded area (rejection region) then ‘Reject H’
• If ztest / ttest is not in the shaded area (rejection region) then ‘Cannot reject H0’
6. Report the conclusion
• ‘Reject H0’ → Yes, there is enough evidence to conclude the mean (or proportion) is …
• ‘Cannot reject H0’ → No, there is not enough evidence to conclude …
Pg 1 of 9
, OPMT 1197
Business Statistics
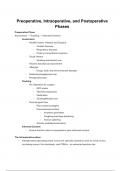
Example 1: On the label of the cans of Nature’s Pet Homestyle Turkey & Liver Stew cat food it
says the net weight is 156 grams. I disagree because I have purchased their cans and have found
that they typically weigh less than 156 grams. Formulate the hypotheses.
Try these: State the null and alternate hypothesis for each of the following situations:
(a) It is believed that the average time required to perform a task after a person undergoes a
particular training program is less than the 15 minutes it normally takes to perform the same
task before training takes place.
(b) I receive a shipment of goods from a supplier and believe that the percentage of defective
parts is greater than the normal 10%.
(c) I believe that a machine that fills 500-gram coffee bags is not set properly, and is not filling
the bags with 500 grams of coffee.
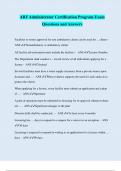
1. On the label of the cans of Nature’s Pet Homestyle Turkey & Liver Stew cat food it says the
net weight is 156 grams. Recently, I have gotten quite a few cans that contained less than 156
grams. To determine whether the pet food maker is lying, I brought my kitchen scale to
several pet food stores and weighed 144 randomly selected cans. An empty can weighs 11
grams so I weighed the unopened cans and then deducted 11 grams. From my sample
I obtain a mean net weight of 150 grams and a standard deviation of 24 grams. Is there
sufficient evidence to conclude that the average net weight is less than 156 grams?
(a) Test the hypotheses at the 5% level of significance.
(b) Could I reject the null hypothesis at the 1% level of significance?
(c) What is the probability of obtaining a sample mean weight of 150 grams or less when
the population mean is 156 grams?
(d) What is the smallest level of significance that I could reject H0?
(e) If I were to conclude that the average weight is less than 156 grams and accuse the pet
food maker of lying, what is the probability that I am wrong?
(f) Calculate the p-value.
Pg 2 of 9
Business Statistics
Lectures 17-18: The Different Hypothesis Tests
Hypothesis Test Null, Alternate Hyp Rejection Region Critical Value P-value
Lower Tail Mean Proportion In the lower tail
Zcrit negative P(Z < −Ztest)
less than, smaller H0:μ=▒ H0: p = ▒
reduced, declined HA: μ < ▒ HA: p < ▒
decreased * tcrit if t * ttest if t
α
In the upper tail
Upper Tail Means Proportion Zcrit positive
P(Z > Ztest)
more than, larger H0:μ=▒ H0: p = ▒
bigger, higher HA:μ>▒ HA: p > ▒ * tcrit if t
increased * ttest if t
α
In both tails
2P(Z < −Ztest)
Two-tailed Mean Proportion Zcrit both ±
changed, different H0:μ=▒ H0: p = ▒
or
not set correctly 2P(Z > +Ztest)
no longer equal to HA:μ≠▒ HA: p ≠ ▒ * tcrit if t
* ttest if t
α/2 α/2
Steps to Perform a Hypothesis Test
1. State the null hypothesis H0 and the alternative hypothesis HA
2. Decide if you should use t or z
• Means: if σ is unknown use t (Sample must come from a normal population if n < 30)
• Proportions: always use z (Both np and n(1 – p) must be at least 5)
3. Get the z-critical value (or tcrit). Draw a picture and shade the rejection region. Formulate
the decision rule (i.e. reject H0 if ztest < – zcrit or ztest > zcrit)
4. Calculate the value of the test statistic (ztest or ttest). Put x (or p ) and ztest on the picture.
x−µ p −p
▪ Mean: ztest =
σ
or ttest = xs− µ ▪ Proportion: ztest =
p(1 − p)
n n n
5. Make a decision
‘Yes, can reject H0’ or ‘no, cannot reject H0 at the 5% (or 1%, 10%) level of significance’.
• If ztest / ttest is in the shaded area (rejection region) then ‘Reject H’
• If ztest / ttest is not in the shaded area (rejection region) then ‘Cannot reject H0’
6. Report the conclusion
• ‘Reject H0’ → Yes, there is enough evidence to conclude the mean (or proportion) is …
• ‘Cannot reject H0’ → No, there is not enough evidence to conclude …
Pg 1 of 9
, OPMT 1197
Business Statistics
Example 1: On the label of the cans of Nature’s Pet Homestyle Turkey & Liver Stew cat food it
says the net weight is 156 grams. I disagree because I have purchased their cans and have found
that they typically weigh less than 156 grams. Formulate the hypotheses.
Try these: State the null and alternate hypothesis for each of the following situations:
(a) It is believed that the average time required to perform a task after a person undergoes a
particular training program is less than the 15 minutes it normally takes to perform the same
task before training takes place.
(b) I receive a shipment of goods from a supplier and believe that the percentage of defective
parts is greater than the normal 10%.
(c) I believe that a machine that fills 500-gram coffee bags is not set properly, and is not filling
the bags with 500 grams of coffee.
1. On the label of the cans of Nature’s Pet Homestyle Turkey & Liver Stew cat food it says the
net weight is 156 grams. Recently, I have gotten quite a few cans that contained less than 156
grams. To determine whether the pet food maker is lying, I brought my kitchen scale to
several pet food stores and weighed 144 randomly selected cans. An empty can weighs 11
grams so I weighed the unopened cans and then deducted 11 grams. From my sample
I obtain a mean net weight of 150 grams and a standard deviation of 24 grams. Is there
sufficient evidence to conclude that the average net weight is less than 156 grams?
(a) Test the hypotheses at the 5% level of significance.
(b) Could I reject the null hypothesis at the 1% level of significance?
(c) What is the probability of obtaining a sample mean weight of 150 grams or less when
the population mean is 156 grams?
(d) What is the smallest level of significance that I could reject H0?
(e) If I were to conclude that the average weight is less than 156 grams and accuse the pet
food maker of lying, what is the probability that I am wrong?
(f) Calculate the p-value.
Pg 2 of 9