OPMT 1197
Business Statistics
Lecture 22 ANOVA formulas
n
g j
xij
j 1i 1
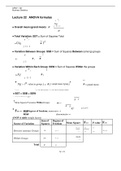
● Overall mean (grand mean): x
n
● Total Variation: SST = Sum of Squares Total
n
g j
SST = (xij x )2
j 1i 1
● Variation Between Groups: SSB = Sum of Squares Between (among) groups
g 2
SSB = n j xj x
j 1
● Variation Within Each Group: SSW = Sum of Squares Within the groups
n 2
g j
SSW = xij xj
j 1i 1
xij = ith value in group j x j = sample mean of group j x = grand mean
g = # of groups nj = # of values in group j n = # of values in all groups combined
● SST = SSB + SSW
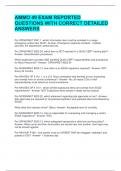
Mean Squared Variation Between (among) Groups: MSB = SSB
g 1
Mean Squared Variation Within Groups: MSW = SSW
n g
g–1 g = # of groups
n–g n = total # of values
Ftest =
MSBDegrees of freedom: numerator =
MSW denominator =
ANOVA table (single factor)
Sum of Degrees of
Source of Variation Squares Freedom Mean Square Ftest P-value Fcrit
MSB = SSB MSB Excel
Between (among) Groups SSB g–1 g−1 MSW output
Fg-1, n-g
MSW = SSW
Within Groups SSW n–g
n−g
Total SST n–1
Pg 1 of 6
, OPMT 1197
Business Statistics
Lab Exercises: Textbook Reading 11.1
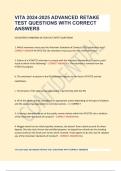
1. You are interested in whether different technologies had different performances on a recent quiz.
You get a sample of five student marks from 3 technologies, with the marks out of 50.
Marketing Fin Man Business Mgmt
32 44 33
30 43 36
30 44 35
26 46 36
32 48 40
Group mean 30 45 36
(a) Compute SST (b) Compute SSB and MSB (c) Compute SSW and MSW
(d) Verify that SST = SSB + SSW (e) Fill out the ANOVA table (use a 1% significance level)
Sum of Degrees of Mean
Source of Variation Squares Freedom Square
Ftest P-value Fcrit
Between (among) Groups 0.0000
Within Groups
Total
(f) Is there evidence of different average marks between the technologies? Test at the 1% level
of significance. Assume the standard deviations are similar in the different technologies.
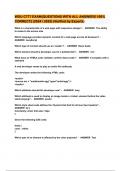
2. An investigator is interested in the effects of sleep deprivation on memory function. He randomly
assigns 19 people to one of four groups. Subjects in the first group take a test of memory function
after they have been awake for eight hours (No sleep deprivation). The second group takes the
test after they have been awake for 18 hours (mild sleep deprivation), the third group after they
have been awake for 24 hours (moderate sleep deprivation) and the last group after they have
been awake for 36 hours (severe sleep deprivation). The results are:
Memory Test Score
None Mild Moderate Severe
(4 numbers) (5 numbers) (5 numbers) (5 numbers)
17 18 17 14
19 15 10 6
20 14 14 12
24 20 13 10
18 16 8
Average 20 17 14 10
(a) Compute the grand mean. (b) Fill out the ANOVA table: (use a 5% significance level)
Sum of Degrees of Mean
Source of Variation Squares Freedom Square
Ftest P-value Fcrit
Between (among) Groups 0.00059
Within Groups
Total
Pg 2 of 6
Business Statistics
Lecture 22 ANOVA formulas
n
g j
xij
j 1i 1
● Overall mean (grand mean): x
n
● Total Variation: SST = Sum of Squares Total
n
g j
SST = (xij x )2
j 1i 1
● Variation Between Groups: SSB = Sum of Squares Between (among) groups
g 2
SSB = n j xj x
j 1
● Variation Within Each Group: SSW = Sum of Squares Within the groups
n 2
g j
SSW = xij xj
j 1i 1
xij = ith value in group j x j = sample mean of group j x = grand mean
g = # of groups nj = # of values in group j n = # of values in all groups combined
● SST = SSB + SSW
Mean Squared Variation Between (among) Groups: MSB = SSB
g 1
Mean Squared Variation Within Groups: MSW = SSW
n g
g–1 g = # of groups
n–g n = total # of values
Ftest =
MSBDegrees of freedom: numerator =
MSW denominator =
ANOVA table (single factor)
Sum of Degrees of
Source of Variation Squares Freedom Mean Square Ftest P-value Fcrit
MSB = SSB MSB Excel
Between (among) Groups SSB g–1 g−1 MSW output
Fg-1, n-g
MSW = SSW
Within Groups SSW n–g
n−g
Total SST n–1
Pg 1 of 6
, OPMT 1197
Business Statistics
Lab Exercises: Textbook Reading 11.1
1. You are interested in whether different technologies had different performances on a recent quiz.
You get a sample of five student marks from 3 technologies, with the marks out of 50.
Marketing Fin Man Business Mgmt
32 44 33
30 43 36
30 44 35
26 46 36
32 48 40
Group mean 30 45 36
(a) Compute SST (b) Compute SSB and MSB (c) Compute SSW and MSW
(d) Verify that SST = SSB + SSW (e) Fill out the ANOVA table (use a 1% significance level)
Sum of Degrees of Mean
Source of Variation Squares Freedom Square
Ftest P-value Fcrit
Between (among) Groups 0.0000
Within Groups
Total
(f) Is there evidence of different average marks between the technologies? Test at the 1% level
of significance. Assume the standard deviations are similar in the different technologies.
2. An investigator is interested in the effects of sleep deprivation on memory function. He randomly
assigns 19 people to one of four groups. Subjects in the first group take a test of memory function
after they have been awake for eight hours (No sleep deprivation). The second group takes the
test after they have been awake for 18 hours (mild sleep deprivation), the third group after they
have been awake for 24 hours (moderate sleep deprivation) and the last group after they have
been awake for 36 hours (severe sleep deprivation). The results are:
Memory Test Score
None Mild Moderate Severe
(4 numbers) (5 numbers) (5 numbers) (5 numbers)
17 18 17 14
19 15 10 6
20 14 14 12
24 20 13 10
18 16 8
Average 20 17 14 10
(a) Compute the grand mean. (b) Fill out the ANOVA table: (use a 5% significance level)
Sum of Degrees of Mean
Source of Variation Squares Freedom Square
Ftest P-value Fcrit
Between (among) Groups 0.00059
Within Groups
Total
Pg 2 of 6