OPMT 1197
Business Statistics
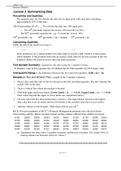
Lecture 3 Summarizing Data
Percentiles and Quartiles:
The quartiles (Q1, Q2, Q3) divides the data into 4 equal parts with each part containing
approximately 25% of the data.
The 99 percentiles (P1, P2, …, P99) divides the data into 100 equal parts
o The 10th percentile separates the bottom 10% from the top 90% o
The 99th percentile separates the top 1% from the bottom 99%
25th percentile = Q1 50th percentile = Q2 = median 75th percentile = Q3
Calculating Quartiles:
Order the data from smallest to largest.
Find each quartile position index ( n - number of data values)
1 2 3
= + 0.5 for Q1, = +0.5 Q2, and = + 0.5Q3
4 4 4
If the position is not a whole number nor ends with an exactly a half, round it to the nearest
whole number. If the position ends with an exactly a half, then we use the average of the two
numbers (before the index position, after the index position).
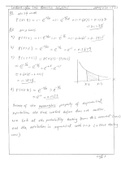
Five Number Summary: summarizes the data using the 5 numbers below:
1. Smallest value 2. First quartile (Q1) 3. Median (Q2) 4. Third quartile (Q3) 5. Largest value
Interquartile Range is the difference between the first and third quartiles: IQR = Q3 – Q1
Boxplot (or Box and Whisker Plot): a graph of the 5-number summary
1. Draw a box with the ends of the box located at the first and third quartiles. The box contains the
middle 50% of the data.
2. Draw a vertical line where the median is located.
3. Find both upper and lower limits: Lower Limit = Q1 – 1.5×IQR, Upper Limit = Q3 + 1.5×IQR
Data values beyond the upper or lower limits are considered outliers.
4. On each end of the box draw dashed lines (whiskers). The right whisker extends to the highest
data value that is not an outlier and the left whisker to the smallest value that’s not an outlier.
5. Add any outliers to the boxplot. Mark them with an asterisk *.
Ex 1: 50 recent graduates of BCIT’s Financial Management program were surveyed about
their starting salaries. Below are their annual starting salaries ordered from smallest to largest.
26325 28500 29600 29950 30570 30625 31250 31750 32000 32500
32750 33000 34000 34250 34500 34850 34850 34900 34950 35000
35500 35600 36000 36160 36750 37250 37750 38485 39000 39515
39800 40000 40020 40250 40500 41600 41900 42000 43150 44000
45000 45200 46150 47225 48650 49750 49950 50550 52800 54975
(a) Summarize the data with a 5-number summary and then do a boxplot. The middle 50% of
starting salaries are between what two values?
Pg 1 of 8
, OPMT 1197
Business Statistics
Tables for Summarizing Data-Frequency
Distributions Steps to Construct a Frequency Table
1. Find the smallest and largest value.
2. Determine the number of classes you want to group the numbers into.
Usually the number of classes varies from 5 to 15, depending on the number of data values. A
guideline for the recommended number of classes using the formula shown below is:
Number of Data Values Number of Classes
9 to 16 4
17 to 32 5
33 to 64 6
65 to 128 7
129 to 256 8
257 to 512 9
513 to 1,024 10
Alternatively, you can use the formula: Number of classes =( )/ ( )
** n = number of data values. Round the number of classes up to a whole number.
The above table for the number of classes is not a rigid rule. Choose a number so that we
retain the right amount of information (not too much detail is lost or retained).
3. Determine the width of each class. It’s best to have the same width for all classes.
Approximate width of interval = Largest value – smallest value = Range
Number of classes # of classes
The class width should be rounded to a convenient number, which may in turn change
the number of classes.
4. Pick an arbitrary starting point.
Usually use a number a little smaller than or equal to the smallest value.
This starting point is the lower boundary of the first class. Then add the class width to it to
find the lower boundary of the second class and so on.
The class boundaries must be such that each value belongs to one and only one class.
5. Count the number belonging to each class (i.e. determine the frequency of each class).
Definitions:
Frequency: The number belonging to each class
Relative Frequency: proportion (or fraction) belonging to each class = frequency/sample size
Percentage frequency: percentage belonging to each class = frequency/sample size×100%
26325 28500 29600 29950 30570 30625 31250 31750 32000 32500
Pg 2 of 8
Business Statistics
Lecture 3 Summarizing Data
Percentiles and Quartiles:
The quartiles (Q1, Q2, Q3) divides the data into 4 equal parts with each part containing
approximately 25% of the data.
The 99 percentiles (P1, P2, …, P99) divides the data into 100 equal parts
o The 10th percentile separates the bottom 10% from the top 90% o
The 99th percentile separates the top 1% from the bottom 99%
25th percentile = Q1 50th percentile = Q2 = median 75th percentile = Q3
Calculating Quartiles:
Order the data from smallest to largest.
Find each quartile position index ( n - number of data values)
1 2 3
= + 0.5 for Q1, = +0.5 Q2, and = + 0.5Q3
4 4 4
If the position is not a whole number nor ends with an exactly a half, round it to the nearest
whole number. If the position ends with an exactly a half, then we use the average of the two
numbers (before the index position, after the index position).
Five Number Summary: summarizes the data using the 5 numbers below:
1. Smallest value 2. First quartile (Q1) 3. Median (Q2) 4. Third quartile (Q3) 5. Largest value
Interquartile Range is the difference between the first and third quartiles: IQR = Q3 – Q1
Boxplot (or Box and Whisker Plot): a graph of the 5-number summary
1. Draw a box with the ends of the box located at the first and third quartiles. The box contains the
middle 50% of the data.
2. Draw a vertical line where the median is located.
3. Find both upper and lower limits: Lower Limit = Q1 – 1.5×IQR, Upper Limit = Q3 + 1.5×IQR
Data values beyond the upper or lower limits are considered outliers.
4. On each end of the box draw dashed lines (whiskers). The right whisker extends to the highest
data value that is not an outlier and the left whisker to the smallest value that’s not an outlier.
5. Add any outliers to the boxplot. Mark them with an asterisk *.
Ex 1: 50 recent graduates of BCIT’s Financial Management program were surveyed about
their starting salaries. Below are their annual starting salaries ordered from smallest to largest.
26325 28500 29600 29950 30570 30625 31250 31750 32000 32500
32750 33000 34000 34250 34500 34850 34850 34900 34950 35000
35500 35600 36000 36160 36750 37250 37750 38485 39000 39515
39800 40000 40020 40250 40500 41600 41900 42000 43150 44000
45000 45200 46150 47225 48650 49750 49950 50550 52800 54975
(a) Summarize the data with a 5-number summary and then do a boxplot. The middle 50% of
starting salaries are between what two values?
Pg 1 of 8
, OPMT 1197
Business Statistics
Tables for Summarizing Data-Frequency
Distributions Steps to Construct a Frequency Table
1. Find the smallest and largest value.
2. Determine the number of classes you want to group the numbers into.
Usually the number of classes varies from 5 to 15, depending on the number of data values. A
guideline for the recommended number of classes using the formula shown below is:
Number of Data Values Number of Classes
9 to 16 4
17 to 32 5
33 to 64 6
65 to 128 7
129 to 256 8
257 to 512 9
513 to 1,024 10
Alternatively, you can use the formula: Number of classes =( )/ ( )
** n = number of data values. Round the number of classes up to a whole number.
The above table for the number of classes is not a rigid rule. Choose a number so that we
retain the right amount of information (not too much detail is lost or retained).
3. Determine the width of each class. It’s best to have the same width for all classes.
Approximate width of interval = Largest value – smallest value = Range
Number of classes # of classes
The class width should be rounded to a convenient number, which may in turn change
the number of classes.
4. Pick an arbitrary starting point.
Usually use a number a little smaller than or equal to the smallest value.
This starting point is the lower boundary of the first class. Then add the class width to it to
find the lower boundary of the second class and so on.
The class boundaries must be such that each value belongs to one and only one class.
5. Count the number belonging to each class (i.e. determine the frequency of each class).
Definitions:
Frequency: The number belonging to each class
Relative Frequency: proportion (or fraction) belonging to each class = frequency/sample size
Percentage frequency: percentage belonging to each class = frequency/sample size×100%
26325 28500 29600 29950 30570 30625 31250 31750 32000 32500
Pg 2 of 8