Applied Data Analysis
Assignment 2
Relationship satisfaction and conflict
Date: 15-03-2021
, Excersise 1: correlations and scatterplot
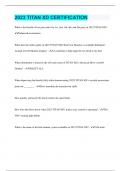
Table 1. Pearson Correlation
how often who guilty who begins how annoyed annoyed
conflicts conflicts reconciliation serious you partner
conflicts
relationship satisfaction -.453*** -.282** .109 -.300*** -.405*** -.207*
how often conflicts .247** -.102 .556*** .443*** .264**
who guilty conflicts -.142 .223** .156 .025
who begins -.020 -.103 -.133
reconciliation
How serious conflicts .208** .199*
annoyed you .514***
*** p < 0.001, ** p < 0.01, * p < 0.05
In the correlation matrix we can see that relationship satisfaction is negatively correlated with
how often people start conflicts (r = .45), who is guilty in conflicts (r = .28), how serious
conflicts are (r = .30), how annoyed you are (r = .41) and how annoyed the partner is (r
= .21). This means that if the forementioned variables get larger, the relationship satisfaction
score gets lower. A positive correlation means that a higher score on one of the variables
means a higher score on the correlated variable as well.
Furthermore, the Pearson correlations range between (r = .56) between how often conflicts
there are conflicts with the partner and how serious the conflicts are, and (r = -.020) for who
begins reconciliation and how serious the conflicts are. This last correlation is not significant
however. The smallest significant correlation is the one between annoyed partner and how
serious conflicts are (r = .20, p < .05)
Assignment 2
Relationship satisfaction and conflict
Date: 15-03-2021
, Excersise 1: correlations and scatterplot
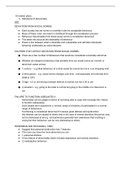
Table 1. Pearson Correlation
how often who guilty who begins how annoyed annoyed
conflicts conflicts reconciliation serious you partner
conflicts
relationship satisfaction -.453*** -.282** .109 -.300*** -.405*** -.207*
how often conflicts .247** -.102 .556*** .443*** .264**
who guilty conflicts -.142 .223** .156 .025
who begins -.020 -.103 -.133
reconciliation
How serious conflicts .208** .199*
annoyed you .514***
*** p < 0.001, ** p < 0.01, * p < 0.05
In the correlation matrix we can see that relationship satisfaction is negatively correlated with
how often people start conflicts (r = .45), who is guilty in conflicts (r = .28), how serious
conflicts are (r = .30), how annoyed you are (r = .41) and how annoyed the partner is (r
= .21). This means that if the forementioned variables get larger, the relationship satisfaction
score gets lower. A positive correlation means that a higher score on one of the variables
means a higher score on the correlated variable as well.
Furthermore, the Pearson correlations range between (r = .56) between how often conflicts
there are conflicts with the partner and how serious the conflicts are, and (r = -.020) for who
begins reconciliation and how serious the conflicts are. This last correlation is not significant
however. The smallest significant correlation is the one between annoyed partner and how
serious conflicts are (r = .20, p < .05)