BBS2007: “Linear and Logistic regression and Repeated Measures Analysis”
Lecture 3
Repeated measures
analysis
Bjorn Winkens
Methodology and Statistics
Maastricht University
Methodology and Statistics | University of Maastricht © Bjorn Winkens 2021
, Content
• Examples of correlated data
– repeated measures
– clustering
• ‘Simple’ methods
– ignoring dependency (WRONG)
– creating independency
• ‘Advanced’ methods (random intercept model)
– accounting for dependency (PREFERRED)
2
, Examples of correlated data
• Repeated measures within same subject
– Left and right eye /arm /leg /…
– Baseline, after 3, 6, and 12 months (“growth curve”)
– Before treatment, directly after treatment (short term
effect), and 12 months after treatment (long term
effect)
BBS2007: focus on this kind of dependency
• Clustered data
– Patients within a physician/surgeon
– Pupils within a class within a school
3
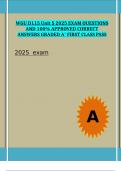
, Example: grade vs study time
But each subject is measured
twice
plotted line
ignores
dependency!
Because there are
more than
measurement per
subject
Conclusion?
4
Lecture 3
Repeated measures
analysis
Bjorn Winkens
Methodology and Statistics
Maastricht University
Methodology and Statistics | University of Maastricht © Bjorn Winkens 2021
, Content
• Examples of correlated data
– repeated measures
– clustering
• ‘Simple’ methods
– ignoring dependency (WRONG)
– creating independency
• ‘Advanced’ methods (random intercept model)
– accounting for dependency (PREFERRED)
2
, Examples of correlated data
• Repeated measures within same subject
– Left and right eye /arm /leg /…
– Baseline, after 3, 6, and 12 months (“growth curve”)
– Before treatment, directly after treatment (short term
effect), and 12 months after treatment (long term
effect)
BBS2007: focus on this kind of dependency
• Clustered data
– Patients within a physician/surgeon
– Pupils within a class within a school
3
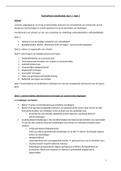
, Example: grade vs study time
But each subject is measured
twice
plotted line
ignores
dependency!
Because there are
more than
measurement per
subject
Conclusion?
4