Week 8: 19/04/21
ECN302 - Advanced Macro – Unconventional Monetary Policy
Video 1
We will look at 2020-2021 monetary policy.
-Conventional Monetary Policy
Conventional conduct of monetary policy since mid-1980s.
Before the 1980s, monetary policy had the objective of achieving macroeconomic stabilisation by
controlling the growth rate of money supply. This approach was heavily criticised & a new approach was
taken in the 1980s.
Conventional monetary policy was about inflation targeting. This means that the CBs objective was to
achieve macroeconomic stabilisation (stabilisation of output and price). The key policy instrument was
the short term IR.
The theoretical framework used to study conventional monetary policy was the New Keynesian (NK)
model.
In 2008, following the financial crisis, this mechanism fell apart because the nominal IR of the CB in most
advanced economies fell to the ZLB. Therefore, CBs lost their conventional policy instrument and
switched to an unconventional one to achieve a similar outcome of macroeconomic stabilisation. Now,
however, the key policy instruments have become the balance sheet of the CB (the CB purchases long
term & private assets) & forward guidance. The NK model is extended to account for unconventional
monetary policy.
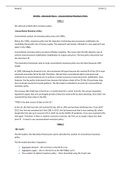
The treasury bill (T-bill) rate is the IR on a 3 month bond (it’s a short term IR). The secular stagnation
hypothesis argues that over prolonged periods of time the nominal IR has been declining. Since 2007, the
nominal IR has been close to the ZLB.
*FRED is the best source of data on the US.*
In the US, the Fed fund rate (US nominal IR) was 18% in 1981 and has been declining since. From 2007-
2015, the Fed rate remained at 0 (the ZLB). In 2015, the Fed announced that it was undoing QE, which
bought the Fed rate up to around 2.5% in 2019. Do to the COVID-19 pandemic, it has now reached 0 (the
ZLB) again. Therefore, if there is another economic recession, the Fed can no longer reduce the short
term IR – it need to use unconventional monetary policy.
Video 2
-NK model
The NK model is the theoretical framework used to describe the conduct of conventional monetary
policy.
The NK model describes 3 equations:
1) Aggregate demand – this is known as the NK IS curve
2) Aggregate supply – this is referred to as the NK Phillips Curve
3) The conduct of optimal monetary policy – this is described using the Taylor rule.
, Week 8: 19/04/21
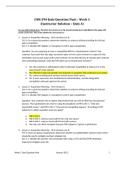
1) NK IS curve:
^x t is the e output gap – it’s the deviation of actual GDP from potential GDP (flex price output). Because of
price rigidities, when there is a real shock, real quantities cannot adjust immediately. This is why at least
in the SR there is an output gap.
l^ t is the nominal IR set by the CB (it’s the Fed fund rate).
Et ^π t +1 is the expected rate of inflation (deviation from target)
l^ t - Et ^π t +1, the difference between the nominal IR & the expectation today of future inflation is the real IR.
This is ex-ante, meaning that it is based on the expectation.
The coefficient 1/σ measures the transmission mechanism – it measures how changes in the nominal IR
are transmitted to the output gap.
In this model, there is no capital, so consumption is equal to output. Therefore, the NK IS curve is derived
from the Euler equation after a number of adjustments.
Thus, the output gap in the current period depends on the expected next period output gap and the ex-
ante real interest rate.
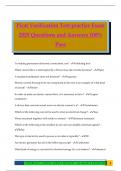
The NK IS curve can be plotted as a straight line in the Cartesian, 2 dimensional space with ^x t on the
horizontal axis and l^ t - Et ^π t +1 on the vertical axis. The slope of the IS curve is -1/σ and the intercept on
the vertical axis is equal to Et ^x t +1.
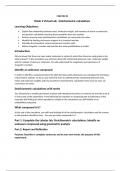
2) NK Phillips curve:
This comes from the production side of the model.
In this model, there are price rigidities because not all firms are able to adjust their prices to maximise
profit. A firm that does not change the price level today w.r.t. yesterday will keep the price level
invariant.
The Phillips curve is the relationship between the inflation rate & the unemployment rate. Since by
Okun’s Law the unemployment rate can be almost expressed as a mirror image of output, this Phillips
curve essentially expresses the inflation rate today as a function of the output gap. κ shows how a
change in the output gap effects inflation. And the inflation rate today depends on the expected inflation
tomorrow.
Therefore, the current inflation rate depends on future expected inflation and the output gap.
β individual discount factor.
κ is a parameter and measures how changes in the output gap are transmitted into inflation.
The NK Phillips curve is derived from the behaviour of firms, as in the Calvo pricing model.
ECN302 - Advanced Macro – Unconventional Monetary Policy
Video 1
We will look at 2020-2021 monetary policy.
-Conventional Monetary Policy
Conventional conduct of monetary policy since mid-1980s.
Before the 1980s, monetary policy had the objective of achieving macroeconomic stabilisation by
controlling the growth rate of money supply. This approach was heavily criticised & a new approach was
taken in the 1980s.
Conventional monetary policy was about inflation targeting. This means that the CBs objective was to
achieve macroeconomic stabilisation (stabilisation of output and price). The key policy instrument was
the short term IR.
The theoretical framework used to study conventional monetary policy was the New Keynesian (NK)
model.
In 2008, following the financial crisis, this mechanism fell apart because the nominal IR of the CB in most
advanced economies fell to the ZLB. Therefore, CBs lost their conventional policy instrument and
switched to an unconventional one to achieve a similar outcome of macroeconomic stabilisation. Now,
however, the key policy instruments have become the balance sheet of the CB (the CB purchases long
term & private assets) & forward guidance. The NK model is extended to account for unconventional
monetary policy.
The treasury bill (T-bill) rate is the IR on a 3 month bond (it’s a short term IR). The secular stagnation
hypothesis argues that over prolonged periods of time the nominal IR has been declining. Since 2007, the
nominal IR has been close to the ZLB.
*FRED is the best source of data on the US.*
In the US, the Fed fund rate (US nominal IR) was 18% in 1981 and has been declining since. From 2007-
2015, the Fed rate remained at 0 (the ZLB). In 2015, the Fed announced that it was undoing QE, which
bought the Fed rate up to around 2.5% in 2019. Do to the COVID-19 pandemic, it has now reached 0 (the
ZLB) again. Therefore, if there is another economic recession, the Fed can no longer reduce the short
term IR – it need to use unconventional monetary policy.
Video 2
-NK model
The NK model is the theoretical framework used to describe the conduct of conventional monetary
policy.
The NK model describes 3 equations:
1) Aggregate demand – this is known as the NK IS curve
2) Aggregate supply – this is referred to as the NK Phillips Curve
3) The conduct of optimal monetary policy – this is described using the Taylor rule.
, Week 8: 19/04/21
1) NK IS curve:
^x t is the e output gap – it’s the deviation of actual GDP from potential GDP (flex price output). Because of
price rigidities, when there is a real shock, real quantities cannot adjust immediately. This is why at least
in the SR there is an output gap.
l^ t is the nominal IR set by the CB (it’s the Fed fund rate).
Et ^π t +1 is the expected rate of inflation (deviation from target)
l^ t - Et ^π t +1, the difference between the nominal IR & the expectation today of future inflation is the real IR.
This is ex-ante, meaning that it is based on the expectation.
The coefficient 1/σ measures the transmission mechanism – it measures how changes in the nominal IR
are transmitted to the output gap.
In this model, there is no capital, so consumption is equal to output. Therefore, the NK IS curve is derived
from the Euler equation after a number of adjustments.
Thus, the output gap in the current period depends on the expected next period output gap and the ex-
ante real interest rate.
The NK IS curve can be plotted as a straight line in the Cartesian, 2 dimensional space with ^x t on the
horizontal axis and l^ t - Et ^π t +1 on the vertical axis. The slope of the IS curve is -1/σ and the intercept on
the vertical axis is equal to Et ^x t +1.
2) NK Phillips curve:
This comes from the production side of the model.
In this model, there are price rigidities because not all firms are able to adjust their prices to maximise
profit. A firm that does not change the price level today w.r.t. yesterday will keep the price level
invariant.
The Phillips curve is the relationship between the inflation rate & the unemployment rate. Since by
Okun’s Law the unemployment rate can be almost expressed as a mirror image of output, this Phillips
curve essentially expresses the inflation rate today as a function of the output gap. κ shows how a
change in the output gap effects inflation. And the inflation rate today depends on the expected inflation
tomorrow.
Therefore, the current inflation rate depends on future expected inflation and the output gap.
β individual discount factor.
κ is a parameter and measures how changes in the output gap are transmitted into inflation.
The NK Phillips curve is derived from the behaviour of firms, as in the Calvo pricing model.