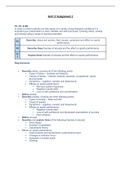
Assignment 1 – A Bathtub
1. Final Time: 10; Time Steep: 1; Units of time: Minutes
2. The model
3. Equations and Units
Variable or Equations Units Explanation
Stocks of Units
Inflow 0 Gallons/ Given
Minute
Water in tub INTEG (Inflow – Outflow, 50) Gallons Given
Outflow 5 Gallons/ Given
Minute
INTEG (R, N) = Performs numerical integration of R starting at N (defines a
Level)
So INTEG is always in stock and it is used to calculate the stock.
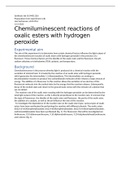
4. Stock and Flow Diagram
Water in tub graph
Range from 0 to 50
5. Graph explanation
After 10 minutes, the water decreases to 0
gallons it is because every minute, the tub is losing 5 gallons of water.
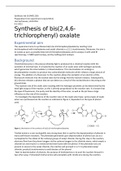
6. In order for the graph of inflow is as below,
the equations of inflow had to be
adjusted to
0 + Step (5,5)
0 means, it will be the starting point
The first 5 is the height and the second 5
is when the step will incur.
7. After adjusting the
inflow equations, the
water in tub graph
become as follows
,The graph change because after the 5th minute, the water of 5 gallons is added
to the tub. Thus, the water stays at 25 gallons until the minute 10 th.
8. Bank account model, Units and Equation
Time: 12 Years
Time Step: 1 (dt)
Variable or Equations Units Explanation
Stocks of Units
Interest 10 Euro/Year Given
Bank Account INTEG (Interest – Spending, Euro Given
100)
Spending 0 Euro/Year Given
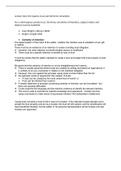
9. The graph of bank account stock become as follows
As can be seen, every year €10 of interest is
added to the account and €0 is spent. Therefore,
the account has linear increase and by year 12 th,
the previously €100 become €220
10. A new variable called interest rate is added and the model is adjusted as
follows
The interest rate of 10% per year is added therefore every year, 10% of the
amount of bank account will be the interest added.
Variable or Equations Units Explanation of Units
Stocks
Interest Interest Rate*Bank Euro/ Given
Account Year
Bank Account INTEG (Interest – Euro Given
, Spending, 100)
Spending 0 Euro/ Given
Year
Interest Rate 0.1 1/Year Because the interest is
added per year
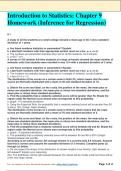
11. The graph changed when the interest rate of 10% is added yearly.
It can be seen that the graph has an
exponential growth. As each year 10% of
what we have in the bank account is added to
the bank account itself.
12. Changing the interest rate, to change it, we just need to change the equation
of the interest rate. While making the graph, we need to save each interest rate
for each data set. Then we can adjust the diagram and add the data sets.
1. Final Time: 10; Time Steep: 1; Units of time: Minutes
2. The model
3. Equations and Units
Variable or Equations Units Explanation
Stocks of Units
Inflow 0 Gallons/ Given
Minute
Water in tub INTEG (Inflow – Outflow, 50) Gallons Given
Outflow 5 Gallons/ Given
Minute
INTEG (R, N) = Performs numerical integration of R starting at N (defines a
Level)
So INTEG is always in stock and it is used to calculate the stock.
4. Stock and Flow Diagram
Water in tub graph
Range from 0 to 50
5. Graph explanation
After 10 minutes, the water decreases to 0
gallons it is because every minute, the tub is losing 5 gallons of water.
6. In order for the graph of inflow is as below,
the equations of inflow had to be
adjusted to
0 + Step (5,5)
0 means, it will be the starting point
The first 5 is the height and the second 5
is when the step will incur.
7. After adjusting the
inflow equations, the
water in tub graph
become as follows
,The graph change because after the 5th minute, the water of 5 gallons is added
to the tub. Thus, the water stays at 25 gallons until the minute 10 th.
8. Bank account model, Units and Equation
Time: 12 Years
Time Step: 1 (dt)
Variable or Equations Units Explanation
Stocks of Units
Interest 10 Euro/Year Given
Bank Account INTEG (Interest – Spending, Euro Given
100)
Spending 0 Euro/Year Given
9. The graph of bank account stock become as follows
As can be seen, every year €10 of interest is
added to the account and €0 is spent. Therefore,
the account has linear increase and by year 12 th,
the previously €100 become €220
10. A new variable called interest rate is added and the model is adjusted as
follows
The interest rate of 10% per year is added therefore every year, 10% of the
amount of bank account will be the interest added.
Variable or Equations Units Explanation of Units
Stocks
Interest Interest Rate*Bank Euro/ Given
Account Year
Bank Account INTEG (Interest – Euro Given
, Spending, 100)
Spending 0 Euro/ Given
Year
Interest Rate 0.1 1/Year Because the interest is
added per year
11. The graph changed when the interest rate of 10% is added yearly.
It can be seen that the graph has an
exponential growth. As each year 10% of
what we have in the bank account is added to
the bank account itself.
12. Changing the interest rate, to change it, we just need to change the equation
of the interest rate. While making the graph, we need to save each interest rate
for each data set. Then we can adjust the diagram and add the data sets.