Samenvatting Introduction to the practice of statistics – Moore, McCabe, Craig
Hoofdstuk 1 – Looking at data
Case = objects described by sets of data (bv. The six songs, in the first colum numbered 1 to 6
Label = special variable used in some data sets to distinguish the different cases (identify cases is a
data set)
Variable = a characteristic of a case (height, gender, salary)
Categorische variabele (categorical variable): places a case into one of several groups or categories
Kwantitatieve variabele (quantitative variable): takes numerical values fot wich arithmetic operations
such as adding and averaging make sense
Distribution: of a variable tells us what values it takes and how often it takes these values
Categorical variables
- Bv. ‘yes’ or ‘no’
- Distribution of a categorical variable lists the categories and gives either the count or the
percent of cases that fall in each category
- Bar graph or pie chart (staafdiagram of cirkeldiagram)
Quantitative variables
- Stemplot (stem-and-lief-plot) gives a quick picture of shape, work best for small numbers of
observations that are all greater than 0
Vb.
1 6 Write the stems
2 3568 write each leaf on the proper stem
3 3455678 arrange the leaves on each stem in order
4 0122338
5 1
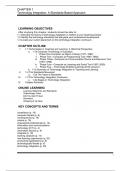
Girls boys
0 8
6 1 28
8653 2 134447788899
8765543 3 11237
8332210 4
1 5
- Histogram: breaks the range of values of a variable into classes en displays only the count of
percent of the observarions that fall into each class. It plots the frequencies (counts) or the
percents of equal-width classes of values (dus 0-10, 10-20 etc.)
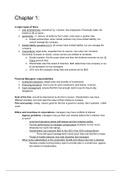
Beschrijven van data (examining a distribution)
- Look for shape center, spread and clear deviations (bv. Outlier) (vorm, centrum, spreiding,
afwijkingen bv. uitbijter)
- One (unimodal) or several peaks (modes)?
- Symmetric or skewed in one direction?
AL9140272 – Samenvatting Inleiding onderzoek (statistiek 1) – ORTHO1
,Center en spread:
Mean (gemiddelde) ̅ : ̅= of compact ̅= ∑
Standard deviation (standaard deviatie) = S = Hoe ver liggen de gegevens gemiddeld van
het gemiddelde af
( ̅) ( ̅)
Eerst variance (variantie): = = ∑( ̅)
S = √ ∑( ̅)
The sum of the deviations of the observations from their mean will always be zero (omdat er
positieve en negatieve observaties zijn, ze vallen op beide zijden van het gemiddelde)
S = 0 when there is no spread
S like the mean, is not resistant. A few outliers can make s very large. Use mean and s for reasonably
symmetric distributions that are free of outliers
Median M: M= dit geeft plek van de mediaan aan, bv 12, dan is het 12e cijfer de
mediaan. Is het 12,5 dan 12e en 13e en dan hiervan het midden.
(mediaan = middelste cijfer)
five number summary
Minimum (laagste cijfer)
Q1 (eerste quartiel, de mediaan links van Q2 = mediaan van de onderste helft)
Median (Q2) (middelste cijfer)
Q3 (derde quartiel, mediaan rechts van Q2 = mediaan bovenste helft getallen)
Maximum (hoogste cijfer)
(vb. denk aan een plank die je in 4 stukken moet snijden, deze doe je eerst door de
helft (=mediaan) dan de je beide helften nog eens door de helft (= Q1 en Q3)
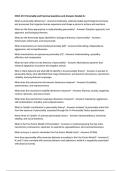
Boxplot = graph of the five number summery
- A central box spans the quartiles Q1 and Q3
- A line in the box marks the M
- Lines extend from the box out to the smallest and largest observation = whiskers = staart
IQR = Interquartile rage = the distance between the first and third quartiles = Q3 – Q1
Q1 = de gegevens aan de linkerkant van de algehele mediaan, en dan hiervan de mediaan
Q3 = de mediaan van de gegevens aan de rechterkant van de algehele mediaan
Dat betekent dat ieder quartil 25% is (aangezien de gegevens nu in 4 delen zijn)
Outliers: 1.5 X IQR rule = call an observation a suspected outlier i fit falls more than 1.5 x IQR above
the third quartile or below the first quatile. (dus boven Q3 of onder Q1)
Q1 – 1.5 x IQR en Q3 + 1.5 x IQR
AL9140272 – Samenvatting Inleiding onderzoek (statistiek 1) – ORTHO1
, Modified boxplot: uses the 1.5 x IQR rule. The lines that extend out from the quartiles are
terminated in whiskers that are 1,5 x IQR in length. Points beyond the
whiskers are plotted individually and are classified as outliers acoording to
the 1.5 x IQR rule. (uitbijters als losse punten)
Side by side boxplot: use two or more boxplots in the same graph to compare groups measured on
the same variable.
Changing the unit of measurement
The same variable can be recorded in different units of measurement (bv. Graden celsius en
Fahrenheit). It is easy to cenvert numerical descriptions of a distribution from one unit of
measurement to another. Because a change is the measurement unit is a linear transformation
(lineair transformeren) of the measurements.
Linear transformation = = a + bx
- Constant a shifts all values of x upward of downward bij the same amount. This does not
change measures of spread
- Multiplying bij the positive constant b changes the size of the unit of measurement. It also
multiplies both measures of center (mean and median) and mearuses of spread (IQR and
standard deviation) by b
- Linear transformations do not change the shape of a distribution
Mean = a + b m = a + bm
Density curves and normal distributions (normale verdeling)
the mean of a density curve is the balance point
the median of a density curve is the equal-areas point(in half)
For a symmetric density curve the median and mean are the same
μ = mean σ = standard deviation
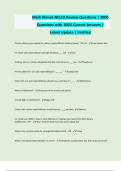
68-95-99,7 Regel:
- 68% van de observaties/gegevens vallen binnen 1 SD σ van het gemiddelde μ
- 95% van de observaties/gegevens vallen binnen 2 SD σ van het gemiddelde μ
- 99,7% van de observaties/gegevens vallen binnen 3 SD σ van het gemiddelde μ
Korte notatie: N( )
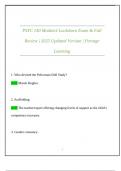
De gestandaliseerde schaal = standardizing (often called) Z-score Z=
De Z score verteld ons hoeveel SD het getal/originele observatie van het gemiddelde af ligt
en aan welke kant, welke richting. Getallen groter dan het gemiddelde zijn positief, getallen
kleiner dat het gemiddelde zijn negatief
Standard normal distribution = Mean 0 en SD 1 = N ( 0 , 1 )
AL9140272 – Samenvatting Inleiding onderzoek (statistiek 1) – ORTHO1
Hoofdstuk 1 – Looking at data
Case = objects described by sets of data (bv. The six songs, in the first colum numbered 1 to 6
Label = special variable used in some data sets to distinguish the different cases (identify cases is a
data set)
Variable = a characteristic of a case (height, gender, salary)
Categorische variabele (categorical variable): places a case into one of several groups or categories
Kwantitatieve variabele (quantitative variable): takes numerical values fot wich arithmetic operations
such as adding and averaging make sense
Distribution: of a variable tells us what values it takes and how often it takes these values
Categorical variables
- Bv. ‘yes’ or ‘no’
- Distribution of a categorical variable lists the categories and gives either the count or the
percent of cases that fall in each category
- Bar graph or pie chart (staafdiagram of cirkeldiagram)
Quantitative variables
- Stemplot (stem-and-lief-plot) gives a quick picture of shape, work best for small numbers of
observations that are all greater than 0
Vb.
1 6 Write the stems
2 3568 write each leaf on the proper stem
3 3455678 arrange the leaves on each stem in order
4 0122338
5 1
Girls boys
0 8
6 1 28
8653 2 134447788899
8765543 3 11237
8332210 4
1 5
- Histogram: breaks the range of values of a variable into classes en displays only the count of
percent of the observarions that fall into each class. It plots the frequencies (counts) or the
percents of equal-width classes of values (dus 0-10, 10-20 etc.)
Beschrijven van data (examining a distribution)
- Look for shape center, spread and clear deviations (bv. Outlier) (vorm, centrum, spreiding,
afwijkingen bv. uitbijter)
- One (unimodal) or several peaks (modes)?
- Symmetric or skewed in one direction?
AL9140272 – Samenvatting Inleiding onderzoek (statistiek 1) – ORTHO1
,Center en spread:
Mean (gemiddelde) ̅ : ̅= of compact ̅= ∑
Standard deviation (standaard deviatie) = S = Hoe ver liggen de gegevens gemiddeld van
het gemiddelde af
( ̅) ( ̅)
Eerst variance (variantie): = = ∑( ̅)
S = √ ∑( ̅)
The sum of the deviations of the observations from their mean will always be zero (omdat er
positieve en negatieve observaties zijn, ze vallen op beide zijden van het gemiddelde)
S = 0 when there is no spread
S like the mean, is not resistant. A few outliers can make s very large. Use mean and s for reasonably
symmetric distributions that are free of outliers
Median M: M= dit geeft plek van de mediaan aan, bv 12, dan is het 12e cijfer de
mediaan. Is het 12,5 dan 12e en 13e en dan hiervan het midden.
(mediaan = middelste cijfer)
five number summary
Minimum (laagste cijfer)
Q1 (eerste quartiel, de mediaan links van Q2 = mediaan van de onderste helft)
Median (Q2) (middelste cijfer)
Q3 (derde quartiel, mediaan rechts van Q2 = mediaan bovenste helft getallen)
Maximum (hoogste cijfer)
(vb. denk aan een plank die je in 4 stukken moet snijden, deze doe je eerst door de
helft (=mediaan) dan de je beide helften nog eens door de helft (= Q1 en Q3)
Boxplot = graph of the five number summery
- A central box spans the quartiles Q1 and Q3
- A line in the box marks the M
- Lines extend from the box out to the smallest and largest observation = whiskers = staart
IQR = Interquartile rage = the distance between the first and third quartiles = Q3 – Q1
Q1 = de gegevens aan de linkerkant van de algehele mediaan, en dan hiervan de mediaan
Q3 = de mediaan van de gegevens aan de rechterkant van de algehele mediaan
Dat betekent dat ieder quartil 25% is (aangezien de gegevens nu in 4 delen zijn)
Outliers: 1.5 X IQR rule = call an observation a suspected outlier i fit falls more than 1.5 x IQR above
the third quartile or below the first quatile. (dus boven Q3 of onder Q1)
Q1 – 1.5 x IQR en Q3 + 1.5 x IQR
AL9140272 – Samenvatting Inleiding onderzoek (statistiek 1) – ORTHO1
, Modified boxplot: uses the 1.5 x IQR rule. The lines that extend out from the quartiles are
terminated in whiskers that are 1,5 x IQR in length. Points beyond the
whiskers are plotted individually and are classified as outliers acoording to
the 1.5 x IQR rule. (uitbijters als losse punten)
Side by side boxplot: use two or more boxplots in the same graph to compare groups measured on
the same variable.
Changing the unit of measurement
The same variable can be recorded in different units of measurement (bv. Graden celsius en
Fahrenheit). It is easy to cenvert numerical descriptions of a distribution from one unit of
measurement to another. Because a change is the measurement unit is a linear transformation
(lineair transformeren) of the measurements.
Linear transformation = = a + bx
- Constant a shifts all values of x upward of downward bij the same amount. This does not
change measures of spread
- Multiplying bij the positive constant b changes the size of the unit of measurement. It also
multiplies both measures of center (mean and median) and mearuses of spread (IQR and
standard deviation) by b
- Linear transformations do not change the shape of a distribution
Mean = a + b m = a + bm
Density curves and normal distributions (normale verdeling)
the mean of a density curve is the balance point
the median of a density curve is the equal-areas point(in half)
For a symmetric density curve the median and mean are the same
μ = mean σ = standard deviation
68-95-99,7 Regel:
- 68% van de observaties/gegevens vallen binnen 1 SD σ van het gemiddelde μ
- 95% van de observaties/gegevens vallen binnen 2 SD σ van het gemiddelde μ
- 99,7% van de observaties/gegevens vallen binnen 3 SD σ van het gemiddelde μ
Korte notatie: N( )
De gestandaliseerde schaal = standardizing (often called) Z-score Z=
De Z score verteld ons hoeveel SD het getal/originele observatie van het gemiddelde af ligt
en aan welke kant, welke richting. Getallen groter dan het gemiddelde zijn positief, getallen
kleiner dat het gemiddelde zijn negatief
Standard normal distribution = Mean 0 en SD 1 = N ( 0 , 1 )
AL9140272 – Samenvatting Inleiding onderzoek (statistiek 1) – ORTHO1