SUMMARY OF THE ECONOMY BY CORE
UNIT ONE: THE CAPITALIST REVOLUTION
1. INTRODUCTION: HOW CAPITALISM REVOLUTIONIZED THE WAY WE LIVE,
AND HOW ECONOMICS ATTEMPTS TO UNDERSTAND THIS AND OTHER
ECONOMIC SYSTEMS
a. Since the 1700s, increases in average living standards became a
permanent feature of economic life in many countries.
i. This was associated with the emergence of a new economic
system called capitalism,
1. Private property, markets and firms play a major role.
ii. Under this new way of organizing the economy,
1. Advances in technology and specialization in products
and tasks raised the amount that could be produced
in a day’s work.
iii. This process, which we call the capitalist revolution, has
been accompanied by growing threats to our natural
environment, and by unprecedented global economic
inequalities.
b. Economics is the study of how people interact with each other,
and with the natural environment, in producing their livelihoods.
c. To compare living standards in each country, we use a measure
called GDP per capita.
i. People obtain their incomes by producing and selling goods
and services.
ii. GDP (gross domestic product) is the total value of
everything produced in a given period such as a year,
iii. GDP per capita corresponds to average annual income.
iv. GDP is also referred to as gross domestic income.
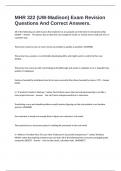
d. The work of Angus Maddison
i. Dedicated his working life to finding the scarce data needed
to make useful comparisons of how people lived across
more than 1,000 years
ii. His work is continuing in the Maddison Project
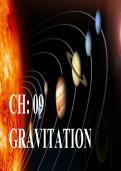
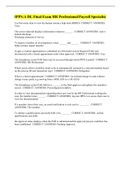
, iii. His work allows us to draw history’s hockey stick:
2. INCOME INEQUALITY
a. A thousand years ago the world was flat in terms of income
(differences in oncome were small, they did exist!)
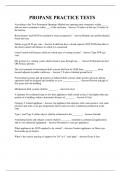
,b. Figure 1.2 shows the distribution of income across and within
countries.
i. Countries are arranged according to GDP per capita from
the poorest on the left of the diagram to the richest on the
right.
ii. The width of each country’s bars represents its population.
iii. Each country has 10 bars = each bar representing one of the
10 deciles of income
iv. The height of each bar is the average income in that decile
v. NOTE: this isn’t the richest 10% of income earners it is the
richest 10% of people
1. Each person in a household (including children) is
assumed to have an equal share of the household’s
income
c. The 90/10 ratio
i. This is a handy measure of inequality
ii. It is defined as the average income of the richest 10%
divided by the average income of the poorest 10%
iii. Commonly defined as the income of the 90th percentile
divided by that of the 10th percentile
d. The vast differences in incomes between countries brings us back
to history’s hockey stick
i. Countries that took off economically before 1900 are rich
now
1. Italy, UK, Japan
ii. Countries that took off recently are still in the ‘flatlands’
, 3. MEASURINGT INCOME AND LIVING STANDARDS
a. Introduction
i. GDP measures the output of the economy in a given period,
such as a year.
ii. Economists need to decide what should be included in GDP
but also give a value to each of these (easiest way to do so
is by using prices)
iii. Thus, GDP corresponds to the total income of everyone in
the country
iv. Is dividing this by the population the best way to measure
standard of living?
b. Disposable income
i. Disposable income is the amount of
1. Wages or salaries,
2. Profit,
3. Rent,
4. Interest
5. Transfer payments from the government or others
a. Unemployment or disability benefits or gifts
Received over a given period such as a year, minus
6. Any transfers the individual made to others
a. Including taxes paid to the government
ii. Thought to be a good measure of living standards because
1. It is the maximum amount of food, housing, clothing
and other goods and services that the person can buy
without having to borrow
iii. This is not the same as GDP per capita!
c. Is our disposable income a good measure of our well-being?
i. Income is a major influence on wellbeing because it allows
us to buy the goods and services that we need or enjoy.
ii. Disposable income leaves out:
1. The quality of our social and physical environment
such as friendships and clean air.
2. The amount of free time we have to relax or spend
time with friends and family.
UNIT ONE: THE CAPITALIST REVOLUTION
1. INTRODUCTION: HOW CAPITALISM REVOLUTIONIZED THE WAY WE LIVE,
AND HOW ECONOMICS ATTEMPTS TO UNDERSTAND THIS AND OTHER
ECONOMIC SYSTEMS
a. Since the 1700s, increases in average living standards became a
permanent feature of economic life in many countries.
i. This was associated with the emergence of a new economic
system called capitalism,
1. Private property, markets and firms play a major role.
ii. Under this new way of organizing the economy,
1. Advances in technology and specialization in products
and tasks raised the amount that could be produced
in a day’s work.
iii. This process, which we call the capitalist revolution, has
been accompanied by growing threats to our natural
environment, and by unprecedented global economic
inequalities.
b. Economics is the study of how people interact with each other,
and with the natural environment, in producing their livelihoods.
c. To compare living standards in each country, we use a measure
called GDP per capita.
i. People obtain their incomes by producing and selling goods
and services.
ii. GDP (gross domestic product) is the total value of
everything produced in a given period such as a year,
iii. GDP per capita corresponds to average annual income.
iv. GDP is also referred to as gross domestic income.
d. The work of Angus Maddison
i. Dedicated his working life to finding the scarce data needed
to make useful comparisons of how people lived across
more than 1,000 years
ii. His work is continuing in the Maddison Project
, iii. His work allows us to draw history’s hockey stick:
2. INCOME INEQUALITY
a. A thousand years ago the world was flat in terms of income
(differences in oncome were small, they did exist!)
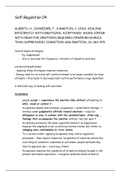
,b. Figure 1.2 shows the distribution of income across and within
countries.
i. Countries are arranged according to GDP per capita from
the poorest on the left of the diagram to the richest on the
right.
ii. The width of each country’s bars represents its population.
iii. Each country has 10 bars = each bar representing one of the
10 deciles of income
iv. The height of each bar is the average income in that decile
v. NOTE: this isn’t the richest 10% of income earners it is the
richest 10% of people
1. Each person in a household (including children) is
assumed to have an equal share of the household’s
income
c. The 90/10 ratio
i. This is a handy measure of inequality
ii. It is defined as the average income of the richest 10%
divided by the average income of the poorest 10%
iii. Commonly defined as the income of the 90th percentile
divided by that of the 10th percentile
d. The vast differences in incomes between countries brings us back
to history’s hockey stick
i. Countries that took off economically before 1900 are rich
now
1. Italy, UK, Japan
ii. Countries that took off recently are still in the ‘flatlands’
, 3. MEASURINGT INCOME AND LIVING STANDARDS
a. Introduction
i. GDP measures the output of the economy in a given period,
such as a year.
ii. Economists need to decide what should be included in GDP
but also give a value to each of these (easiest way to do so
is by using prices)
iii. Thus, GDP corresponds to the total income of everyone in
the country
iv. Is dividing this by the population the best way to measure
standard of living?
b. Disposable income
i. Disposable income is the amount of
1. Wages or salaries,
2. Profit,
3. Rent,
4. Interest
5. Transfer payments from the government or others
a. Unemployment or disability benefits or gifts
Received over a given period such as a year, minus
6. Any transfers the individual made to others
a. Including taxes paid to the government
ii. Thought to be a good measure of living standards because
1. It is the maximum amount of food, housing, clothing
and other goods and services that the person can buy
without having to borrow
iii. This is not the same as GDP per capita!
c. Is our disposable income a good measure of our well-being?
i. Income is a major influence on wellbeing because it allows
us to buy the goods and services that we need or enjoy.
ii. Disposable income leaves out:
1. The quality of our social and physical environment
such as friendships and clean air.
2. The amount of free time we have to relax or spend
time with friends and family.