Exam 1
Exam Page 1
Define each of the following:
a) Element.
An element is described as "the individual and
unique entry in a data set about which data has been
collected, analyzed and presented in a same manner
to differentiate" (Module 1). b) Variable.
A variable is defined as a "particular measurable attribute
that the researcher believes is needed to describe the
element in their study" (Module 1).
c) Data.
Data (or the plural of datumn) is defined as things (such
as numerical information, people, geographical
areas,etc.) about which information can be collected and
then analyzed.
Answer Key
Define each of the following:
a) Element.
a) The element of a data set is simply the individual and unique
entry in a data set about which data has been collected, analyzed
and presented in the same manner. b) Variable.
b) A variable is a particular, measurable attribute that the
researcher believes is needed to describe the element in their
study.
c) Data.
c) Data are things about which information can be collected and
analyzed.
, lOMoARcPSD|64492663
Exam Page 2
Explain the difference between population and sample.
"The entire number of items in a large group" would be defined as the population. (Module 1)
The sample is then taken from the population by a researcher and is studied.The sample taken
from the population is, in fact, the subset of the population. You need the population to get
the sample and without the population, there can be no sample.
Instructor Comments
Very good definitions.
Answer Key
Explain the difference between population and sample.
Population is the entire number of items in a large group.
A sample is representative group from the population.
Exam Page 3
Look at the following data and see if you can identify any outliers:
65 71 55 69 3 77 67 70 246 61 277
3, 246, 277
Instructor Comments
Very good.
Answer Key
Look at the following data and see if you can identify any outliers:
65 71 55 69 3 77 67 70 246 61 277
The outliers are:
3 246 277
, lOMoARcPSD|64492663
Exam Page 4
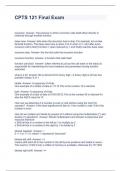
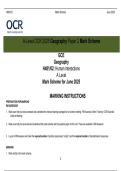
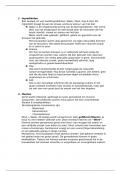
The following pie chart shows the percentages of total items sold in a month in a certain fast food
restaurant.
A total of 4900 fast food items were sold during
the month. How many were burgers? How many
were french fries?
4900(.32)=1568
32% or 1,568 burgers were sold during the month.
4900(.18)=882
18% or 882 french fries were sold during the month.
Instructor Comments
Very good.
Answer Key
The following pie chart shows the percentages of total items sold in a month in a certain fast
food restaurant.
Exam 2
Exam Page 1
During an hour at a fast food restaurant, the following types of sandwiches are ordered:
Turkey Hamburger Cheeseburger Fish Hamburger Turkey Fish
Chicken Fish Chicken Turkey Fish Hamburger Fish
Cheeseburger Fish Cheeseburger Hamburger Fish Fish
, lOMoARcPSD|64492663
A total of 4900 fast food items were sold during the month. How many were burgers? How many were fren
Burgers : 4900(.32) = 1568
French Fries : 4900(.18) = 882
Cheeseburger Hamburger Fish Turkey Turkey Chicken Fish
Chicken Cheeseburger Fish Turkey Fish Fish Hamburger
Fish Fish Turkey Chicken Hamburger Fish Cheeseburger
Chicken Chicken Turkey Fish Chicken
Hamburger Chicken Fish Chicken
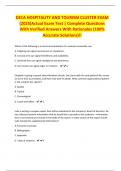
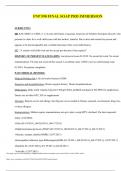
a) Make a frequency distribution for this data.
Types of Frequency
Sandwiches
Turkey 8
Chicken 10
Cheeseburger 6
Fish 18
Hamburger 8
Total 50
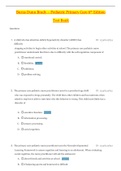
b) Make a relative frequency distribution for this data. Include relative percentages on this table.
Types of Frequency Relative Relative
Sandwiches Frequency
Turkey 8 (8/50)= .16 (.16)100= 16% Percentage
Chicken 10 (10/50)= .20 (.20)100= 20%
Cheeseburger 6 (6/50)= .12 (.12)100=
12%
Fish 18 (18/50)= .36 (.36)100= 36%
Hamburger 8 (8/50)= .16 (.16)100= 16%
Total 50 1 100%
Exam Page 1
Define each of the following:
a) Element.
An element is described as "the individual and
unique entry in a data set about which data has been
collected, analyzed and presented in a same manner
to differentiate" (Module 1). b) Variable.
A variable is defined as a "particular measurable attribute
that the researcher believes is needed to describe the
element in their study" (Module 1).
c) Data.
Data (or the plural of datumn) is defined as things (such
as numerical information, people, geographical
areas,etc.) about which information can be collected and
then analyzed.
Answer Key
Define each of the following:
a) Element.
a) The element of a data set is simply the individual and unique
entry in a data set about which data has been collected, analyzed
and presented in the same manner. b) Variable.
b) A variable is a particular, measurable attribute that the
researcher believes is needed to describe the element in their
study.
c) Data.
c) Data are things about which information can be collected and
analyzed.
, lOMoARcPSD|64492663
Exam Page 2
Explain the difference between population and sample.
"The entire number of items in a large group" would be defined as the population. (Module 1)
The sample is then taken from the population by a researcher and is studied.The sample taken
from the population is, in fact, the subset of the population. You need the population to get
the sample and without the population, there can be no sample.
Instructor Comments
Very good definitions.
Answer Key
Explain the difference between population and sample.
Population is the entire number of items in a large group.
A sample is representative group from the population.
Exam Page 3
Look at the following data and see if you can identify any outliers:
65 71 55 69 3 77 67 70 246 61 277
3, 246, 277
Instructor Comments
Very good.
Answer Key
Look at the following data and see if you can identify any outliers:
65 71 55 69 3 77 67 70 246 61 277
The outliers are:
3 246 277
, lOMoARcPSD|64492663
Exam Page 4
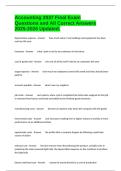
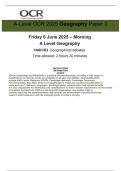
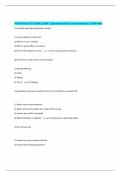
The following pie chart shows the percentages of total items sold in a month in a certain fast food
restaurant.
A total of 4900 fast food items were sold during
the month. How many were burgers? How many
were french fries?
4900(.32)=1568
32% or 1,568 burgers were sold during the month.
4900(.18)=882
18% or 882 french fries were sold during the month.
Instructor Comments
Very good.
Answer Key
The following pie chart shows the percentages of total items sold in a month in a certain fast
food restaurant.
Exam 2
Exam Page 1
During an hour at a fast food restaurant, the following types of sandwiches are ordered:
Turkey Hamburger Cheeseburger Fish Hamburger Turkey Fish
Chicken Fish Chicken Turkey Fish Hamburger Fish
Cheeseburger Fish Cheeseburger Hamburger Fish Fish
, lOMoARcPSD|64492663
A total of 4900 fast food items were sold during the month. How many were burgers? How many were fren
Burgers : 4900(.32) = 1568
French Fries : 4900(.18) = 882
Cheeseburger Hamburger Fish Turkey Turkey Chicken Fish
Chicken Cheeseburger Fish Turkey Fish Fish Hamburger
Fish Fish Turkey Chicken Hamburger Fish Cheeseburger
Chicken Chicken Turkey Fish Chicken
Hamburger Chicken Fish Chicken
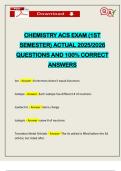
a) Make a frequency distribution for this data.
Types of Frequency
Sandwiches
Turkey 8
Chicken 10
Cheeseburger 6
Fish 18
Hamburger 8
Total 50
b) Make a relative frequency distribution for this data. Include relative percentages on this table.
Types of Frequency Relative Relative
Sandwiches Frequency
Turkey 8 (8/50)= .16 (.16)100= 16% Percentage
Chicken 10 (10/50)= .20 (.20)100= 20%
Cheeseburger 6 (6/50)= .12 (.12)100=
12%
Fish 18 (18/50)= .36 (.36)100= 36%
Hamburger 8 (8/50)= .16 (.16)100= 16%
Total 50 1 100%