STATISTICS week 6
Comparing the mean of two groups
Paired samples t-test
Compares two means based on paired (related) data. Data from the same people
measured at different times. You compare means within a group.
Independent sample t-test
Compares two means based on independent data. Data from different groups of
people. You compare between groups. The observations are dependent.
T-test assumptions
- Test on means: interval/ratio
- The dependent variable needs to be interval/ratio, the independent variable is
categorical with two groups
- Compares groups: 2 groups
- You need a random sample
- You need a normal distribution
- Normal distribution/N>30 (paired)
- Observations are dependent (paired)
- Likert scale is interval
D = mean/standard deviation
Always check the effect size that tells you if the difference is practically relevant. The
formula for the paired sample t-test is d = difference mean/standard deviation.
0,2 = small
0,5 = medium
0,8 = large
Paired samples t-test in SPSS
Analyze > compare means > paired samples t-test > select two variables (first: post
variable, second: pre variable) > options: 95% confidence > paste > run
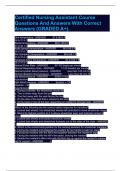
Report paired samples t-test
A dependent t-test revealed that hygiene scores on day 1 (M=1.65, SD=0.64) were
significantly higher than hygiene scores on day 3 (M=0.98, SD=0.71) when visiting a
festival, t(122)=10.59, p<.001, d=0.95, 95% CI [0.55, 0.80]. We reject the null hypothesis
that in the population there is no difference in hygiene scores between day 1 and day 3.
What can we see in the test results?
Mean difference, standard deviation, standard error and a confidence interval, t, d, p.
Confidence interval 95%
No zero in the confidence interval, hence the mean difference is likely to not be zero in the
population (95% confident). If there is a zero in the confidence interval, the mean
difference is likely to be zero in the population. So we are 95% confident that there is no
mean difference. This is the case when the result is not significant.
Comparing 2 groups (independent sample t-test)
We look at the difference in means between the groups.
H0: In the population the mean score for (women) is not different from the mean
score for (men)
1
, H1: In the population the mean score for (women) is different from the mean score
for (men)
The variance in both groups are equal!
Levene’s test
After running the test first check the Levene’s test. It gives you a F-value and a significant
value.
H0: In the population there is no difference in variances
H1: In the population there is a difference in variances.
If the Levene’s test is significant, you reject the null hypothesis, there is a difference in
variances. If the Levene’s test isn’t significant, you retain the null hypothesis, there is no
difference in variances. You don’t want to reject your null hypothesis because the variance
in both groups have to be equal so you don’t want a significant p-value. If you have a
significant F-value you need to check the ‘equal variances not assumed’ row.
If you want to know if the independent sample t-test is significant you check the ‘sig. (2-
tailed)’ column and choose the correct row.
Use this formula to calculate Cohen’s d for independent t-test: d = (2*t)/√df
Independent sample t-test in SPSS
Analyze > compare means > independent samples t-test > select numeric variable >
identify the groups you want to compare > options: 95% confidence > paste > run
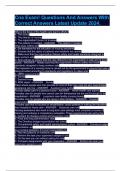
Report independent sample t-test
An independent samples t-test was conducted to examine whether women and men
differed in how worries they are after being exposed to threatening search results about a
health symptom. Levene’s test for equality of variances was not significant, F=0.95, p
= .333. Results revealed that women were not significantly more worried (M=3.13,
SD=1.62) than men (M=2.50, SD=1.31), t(114)=-1.92, p = .057, 95% CI [-1.28, 0.02],
d=0.36. We found no support for the alternative hypothesis.
STATISTICS week 7
Comparing more than 2 groups > ANOVA
1. When the independent variable is categorical
2. When we want to compare more than 2 groups
3. When the dependent variable is numerical (at least interval)
4. Participants are randomly assigned (everyone has an equal probability of being
assigned to a certain group)
5. Groups are of approximate equal size (10%) or equal variances for the dependent
variable in the population (F-test).
H0: In the population the mean does not differ between groups
H1: In the population at least two of the group means differ
Equal variance in the population
Check homogeneity of variance when largest group is more than 10% larger than the
smallest group. If the Levence’s test is significant then that means the variances between
the groups are not equal. You mention in the end that you did not meet the assumption of
equality of variances.
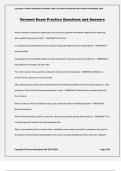
Tables from one way ANOVA
2
Comparing the mean of two groups
Paired samples t-test
Compares two means based on paired (related) data. Data from the same people
measured at different times. You compare means within a group.
Independent sample t-test
Compares two means based on independent data. Data from different groups of
people. You compare between groups. The observations are dependent.
T-test assumptions
- Test on means: interval/ratio
- The dependent variable needs to be interval/ratio, the independent variable is
categorical with two groups
- Compares groups: 2 groups
- You need a random sample
- You need a normal distribution
- Normal distribution/N>30 (paired)
- Observations are dependent (paired)
- Likert scale is interval
D = mean/standard deviation
Always check the effect size that tells you if the difference is practically relevant. The
formula for the paired sample t-test is d = difference mean/standard deviation.
0,2 = small
0,5 = medium
0,8 = large
Paired samples t-test in SPSS
Analyze > compare means > paired samples t-test > select two variables (first: post
variable, second: pre variable) > options: 95% confidence > paste > run
Report paired samples t-test
A dependent t-test revealed that hygiene scores on day 1 (M=1.65, SD=0.64) were
significantly higher than hygiene scores on day 3 (M=0.98, SD=0.71) when visiting a
festival, t(122)=10.59, p<.001, d=0.95, 95% CI [0.55, 0.80]. We reject the null hypothesis
that in the population there is no difference in hygiene scores between day 1 and day 3.
What can we see in the test results?
Mean difference, standard deviation, standard error and a confidence interval, t, d, p.
Confidence interval 95%
No zero in the confidence interval, hence the mean difference is likely to not be zero in the
population (95% confident). If there is a zero in the confidence interval, the mean
difference is likely to be zero in the population. So we are 95% confident that there is no
mean difference. This is the case when the result is not significant.
Comparing 2 groups (independent sample t-test)
We look at the difference in means between the groups.
H0: In the population the mean score for (women) is not different from the mean
score for (men)
1
, H1: In the population the mean score for (women) is different from the mean score
for (men)
The variance in both groups are equal!
Levene’s test
After running the test first check the Levene’s test. It gives you a F-value and a significant
value.
H0: In the population there is no difference in variances
H1: In the population there is a difference in variances.
If the Levene’s test is significant, you reject the null hypothesis, there is a difference in
variances. If the Levene’s test isn’t significant, you retain the null hypothesis, there is no
difference in variances. You don’t want to reject your null hypothesis because the variance
in both groups have to be equal so you don’t want a significant p-value. If you have a
significant F-value you need to check the ‘equal variances not assumed’ row.
If you want to know if the independent sample t-test is significant you check the ‘sig. (2-
tailed)’ column and choose the correct row.
Use this formula to calculate Cohen’s d for independent t-test: d = (2*t)/√df
Independent sample t-test in SPSS
Analyze > compare means > independent samples t-test > select numeric variable >
identify the groups you want to compare > options: 95% confidence > paste > run
Report independent sample t-test
An independent samples t-test was conducted to examine whether women and men
differed in how worries they are after being exposed to threatening search results about a
health symptom. Levene’s test for equality of variances was not significant, F=0.95, p
= .333. Results revealed that women were not significantly more worried (M=3.13,
SD=1.62) than men (M=2.50, SD=1.31), t(114)=-1.92, p = .057, 95% CI [-1.28, 0.02],
d=0.36. We found no support for the alternative hypothesis.
STATISTICS week 7
Comparing more than 2 groups > ANOVA
1. When the independent variable is categorical
2. When we want to compare more than 2 groups
3. When the dependent variable is numerical (at least interval)
4. Participants are randomly assigned (everyone has an equal probability of being
assigned to a certain group)
5. Groups are of approximate equal size (10%) or equal variances for the dependent
variable in the population (F-test).
H0: In the population the mean does not differ between groups
H1: In the population at least two of the group means differ
Equal variance in the population
Check homogeneity of variance when largest group is more than 10% larger than the
smallest group. If the Levence’s test is significant then that means the variances between
the groups are not equal. You mention in the end that you did not meet the assumption of
equality of variances.
Tables from one way ANOVA
2