MATH 225N Week 5 Assignment: Understanding Normal Distribution Questions And Answers( Complete Solution Rated A)
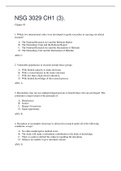
MATH 225N Week 5 Understanding Normal Distribution (From the Video) Question: In2014, the CDC estimated that the mean height for adult women in the U.S. was 64 inches with a standard deviation of 4 S uppose X, height in inches of adult women, follows a normal distribution. Let x=68, the height of a woman who is 5′ 8″ tall. Find and interpret the z-score of the standardized normal random variable. Question: The graph below shows the graphs of several normal distributions, labeledA, B, and C, on the same axis. Determine which normal distribution has the smalleststandard deviation. Question: SupposeX∼N(18,2), and x=22. Find and interpret the z-score of the standardized normal random variable. Question: The graph below shows the graphs of several normal distributions, labeledA, B, and C, on the same axis. Determine which normal distribution has the smallest standard deviation. Question: The graph below shows the graphs of several normal distributions, labeledA, B, and C, on the same axis. Determine which normal distribution has the smallest mean Question: The graph below shows the graphs of several normal distributions, labeledA, B, and C, on the same axis. Determine which normal distribution has the smalleststandard deviation Question: The graph below shows the graphs of several normal distributions, labeledA, B, and C, on the same axis. Determine which normal distribution has the smallest mean. Question: Given the plot of normal distributionsA and B below, which of the following statements is true? Select all correct answers. Question: The graph below shows the graphs of several normal distributions, labeledA, B, and C, on the same axis. Determine which normal distribution has the largest standard deviation. Question: Given the plot of normal distributions A and B below, which of the following statements is true? Select all correct answers. Question: The graph below shows the graphs of several normal distributions, labeledA, B, and C, on the same axis. Determine which normal distribution has the largest standard deviation. Question: The graph below shows the graphs of several normal distributions, labeled A, B, and C, on the same axis. Determine which normal distribution has the smallest mean. Question: Which of the following lists of data has the smallest standard deviation? Select the correct answer below: Question: Which of the following lists of data has the smallest standard deviation? Select the correct answer below: Question: Given the plot of normal distributionsA and B below, which of the following statements is true? Select all correct answers. Question: Given the plot of normal distributionsA and B below, which of the following statements is true? Select all correct answers. Question: The graph below shows the graphs of several normal distributions, labeledA, B, and C, on the same axis. Determine which normal distribution has the largest mean. Question: Given the plot of normal distributionsA and B below, which of the following statements is true? Select all correct answers. Question: SupposeX∼N(5,1.5), and x=11. Find and interpret the z-score of the standardized normal random variable. Question: Isabella averages17 points per basketball game with a standard deviation of 4 Suppose Isabella’s points per basketball game are normally distributed. Let X= the number of points per basketball game. Then X∼N(17,4). Question: Suppose X∼N(17,6), and x=5. Find and interpret the z-score of the standardized normal random variable. Question: The mean height of teenage males from Chile is 170 cm with a standard deviation of 28 cm. Male heights are known to follow a normal distribution. Let X = the height of a teenage male from Chile. Then X∼N(170,6.28). Question: SupposeX∼N(5,2), and x=7.5. Find and interpret the z-score of the standardized normal random variable Question: Jerome averages16 points a game with a standard deviation of 4 Suppose Jerome’s points per game are normally distributed. Let X = the number of points per game. Then X∼N(16,4). Question: SupposeX∼N(10,5), and x=11.5. Find and interpret the z-score of the standardized normal random variable. Question: Annie averages23 points per basketball game with a standard deviation of 4 Suppose Annie’s points per basketball game are normally distributed. Let X= the number of points per basketball game. Then X∼N(23,4). Question: SupposeX∼N(9,5), and x=13.5. Find and interpret the z-score of the standardized normal random variable. Question: In2014, the CDC estimated that the mean height for adult women in the U.S. was 64 inches with a standard deviation of 4 Suppose X, height in inches of adult women, follows a normal distribution. Let x=68, the height of a woman who is 5′ 8″ tall. Find and interpret the z-score of the standardized normal random variable. Question: Rosetta averages148 points per bowling game with a standard deviation of 14 Suppose Rosetta’s points per bowling game are normally distributed. Let X= the number of points per bowling game. Then X∼N(148,14). If necessary, round to three decimal places. Question: Gail averages64 words per minute on a typing test with a standard deviation of 5 words per minute. Suppose Gail’s words per minute on a typing test are normally distributed. Let X= the number of words per minute on a typing test. Then X∼N(64,9.5). If necessary, round to three decimal places. Question: William averages58 words per minute on a typing test with a standard deviation of 5 words per minute. Suppose William’s words per minute on a typing test are normally distributed. Let X= the number of words per minute on a typing test. Then X∼N(58,10.5).If necessary, round to three decimal places. Question: SupposeX∼N(5,1.5), and x=9. Find and interpret the z-score of the standardized normal random variable. Question: Suppose X∼N(16.5,0.5), and x=16. Find and interpret the z-score of the standardized normal random variable. Show Less
Written for
- Institution
-
Chamberlain College Of Nursing
- Course
-
Math 225N
Document information
- Uploaded on
- April 14, 2021
- Number of pages
- 7
- Written in
- 2020/2021
- Type
- Exam (elaborations)
- Contains
- Questions & answers
Subjects
- in2014
-
math 225n week 5 assignment understanding normal distribution questions and answers complete solution rated a
-
the cdc estimated that the mean height for adult women in the us was 64 inche
Also available in package deal