Investigating and Modelling Linear Associations
Two Numeric Variables
Example: The number of hours you
spent studying for a maths test
(explanatory variable) should have an
influence/explain your test score
(response variable)
Scatterplots
Scatterplots enable us to display the relationship between two numeric variables on a graph
The Explanatory Variable is graphed on the horizontal axis (x-axis) and the Response Variable is graphed on
the vertical axis (y-axis)
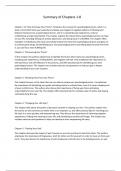
Each dot on the scatterplot represents
one piece of data gathered.
For example, this dot represents a
person who worked 63 hours in a
week and had 2 hours of recreation.
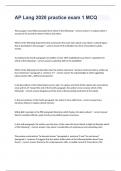
Scatterplots on the CAS
Input data into two separate, labelled columns on a spreadsheet
Ctrl + Doc → 5. Data and Statistics → Add explanatory variable on x-axis
Menu → 2. Plot Properties → 8. Add Y Variable
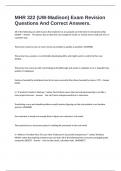
, Interpreting Strength, Direction and Form
Strength: Describes how scattered or closely plotted the data points are. The stronger an association the clearer the
pattern in the association.
If asked to describe the trend
Direction: Describes the general trend of the association (positive or negative). use the words: generally
increasing/decreasing trend
Form: Describes whether the association shows a straight-line trend or not (line or non-linear)
Linear Non-Linear
Strong, Positive Moderate, Positive
Weak, Positive Association
Association Association
No Association
Strong, Negative Moderate, Negative Weak, Negative
Association Association Association
Two Numeric Variables
Example: The number of hours you
spent studying for a maths test
(explanatory variable) should have an
influence/explain your test score
(response variable)
Scatterplots
Scatterplots enable us to display the relationship between two numeric variables on a graph
The Explanatory Variable is graphed on the horizontal axis (x-axis) and the Response Variable is graphed on
the vertical axis (y-axis)
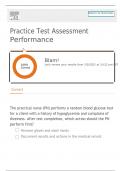
Each dot on the scatterplot represents
one piece of data gathered.
For example, this dot represents a
person who worked 63 hours in a
week and had 2 hours of recreation.
Scatterplots on the CAS
Input data into two separate, labelled columns on a spreadsheet
Ctrl + Doc → 5. Data and Statistics → Add explanatory variable on x-axis
Menu → 2. Plot Properties → 8. Add Y Variable
, Interpreting Strength, Direction and Form
Strength: Describes how scattered or closely plotted the data points are. The stronger an association the clearer the
pattern in the association.
If asked to describe the trend
Direction: Describes the general trend of the association (positive or negative). use the words: generally
increasing/decreasing trend
Form: Describes whether the association shows a straight-line trend or not (line or non-linear)
Linear Non-Linear
Strong, Positive Moderate, Positive
Weak, Positive Association
Association Association
No Association
Strong, Negative Moderate, Negative Weak, Negative
Association Association Association