Paper 6 final revision
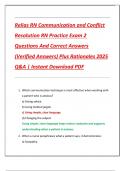
Food tests
Food group Reagent Original colour +ve result Safety
precaution
Starch Iodine Yellowish brown Blue black Eye goggles –
lab coat –
gloves
Reducing sugar Benedict’s Blue Green – yellow – Heating in a
(Needs heating) orange – red water bath
(from least to
highest conc.)
Protein Biuret Blue Purple Eye goggles –
lab coat –
gloves
Fat (Lipids) Ethanol + water Clear solution White suspension Eye goggles –
(Emulsion test) lab coat –
gloves
Vitamin C DCPIP Blue Colourless Eye goggles –
lab coat –
gloves
NB: Adding amylase to starch:
1. Turns the positive iodine test into negative (starch digested)
2. Turns a negative Benedict’s test into positive (maltose/glucose are produced)
Factors affecting enzyme action:
1. Temperature (idea of K.E & rate of collisions) 2. pH
3. Enzyme conc. (increases with increasing enzyme conc.)
4. Substrate conc. (increases with increasing substrate conc.)
5. S.A (increases with increasing S.A)
NB: Very high temperature & extremes of pH causes denaturing of enzymes
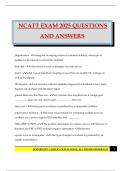
Making tables
1. Draw the table with a pencil & a ruler with at least 2 columns.
2. Left side: variable changed (ex: Temp.) – Right side: variable measured (ex: time)
3. Write down the name of the variables in the headings & include the units
4. Put the data in the table (without units)
NB: If time is given in min & sec (ex: 1:20), it should be converted into seconds (80).
, Describing graphs
Find a relation between the variable changed on the x-axis & the variable measured on the y-
axis (ex: when the temperature increases, the rate of reaction ………….).
If the graph is made of different parts (phases), describe each phase separately.
(ex: increased then decreased, increased slowly then rapidly, ………).
Use figures from the graph in your answer (ex: increased to reach a peak of …… at ……..).
Take care:
Never mention a scientific explanation in a description question. (ex: Because enzyme was denatured).
Making graphs
1. Choice of axis:
X-axis: Variable changed
Y-axis: Variable measured
2. Labeling the axes including the units
3. Scale:
Start from the zero
Adjust the scale so that the graph fills more than half of the page (divide the biggest
number by the number of big squares)
4. Plots (x or O)
5. Join the points (smooth curve – line of best fit – bar chart – histogram)
6. Line of best fit sometimes means that you should choose the best way to join the points with
NB: Read the question carefully to know exactly what you should plot on the graph (which
variables from the table)
NB: Use a key in case of plotting data for 2 categories on the same grid
NB: Do not extend the graph to the zero unless it has a point at zero
NB: Use a break if it’s impossible to apply a suitable scale (last option)
Anomalous results
This is a wrong result that happened because of a certain error
It appears as a different result from the others in a table or an off point on the graph (not with
the trend of the graph)
It can be excluded by: Repeating the experiment for more reliability
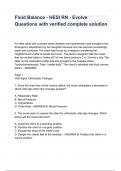
Food tests
Food group Reagent Original colour +ve result Safety
precaution
Starch Iodine Yellowish brown Blue black Eye goggles –
lab coat –
gloves
Reducing sugar Benedict’s Blue Green – yellow – Heating in a
(Needs heating) orange – red water bath
(from least to
highest conc.)
Protein Biuret Blue Purple Eye goggles –
lab coat –
gloves
Fat (Lipids) Ethanol + water Clear solution White suspension Eye goggles –
(Emulsion test) lab coat –
gloves
Vitamin C DCPIP Blue Colourless Eye goggles –
lab coat –
gloves
NB: Adding amylase to starch:
1. Turns the positive iodine test into negative (starch digested)
2. Turns a negative Benedict’s test into positive (maltose/glucose are produced)
Factors affecting enzyme action:
1. Temperature (idea of K.E & rate of collisions) 2. pH
3. Enzyme conc. (increases with increasing enzyme conc.)
4. Substrate conc. (increases with increasing substrate conc.)
5. S.A (increases with increasing S.A)
NB: Very high temperature & extremes of pH causes denaturing of enzymes
Making tables
1. Draw the table with a pencil & a ruler with at least 2 columns.
2. Left side: variable changed (ex: Temp.) – Right side: variable measured (ex: time)
3. Write down the name of the variables in the headings & include the units
4. Put the data in the table (without units)
NB: If time is given in min & sec (ex: 1:20), it should be converted into seconds (80).
, Describing graphs
Find a relation between the variable changed on the x-axis & the variable measured on the y-
axis (ex: when the temperature increases, the rate of reaction ………….).
If the graph is made of different parts (phases), describe each phase separately.
(ex: increased then decreased, increased slowly then rapidly, ………).
Use figures from the graph in your answer (ex: increased to reach a peak of …… at ……..).
Take care:
Never mention a scientific explanation in a description question. (ex: Because enzyme was denatured).
Making graphs
1. Choice of axis:
X-axis: Variable changed
Y-axis: Variable measured
2. Labeling the axes including the units
3. Scale:
Start from the zero
Adjust the scale so that the graph fills more than half of the page (divide the biggest
number by the number of big squares)
4. Plots (x or O)
5. Join the points (smooth curve – line of best fit – bar chart – histogram)
6. Line of best fit sometimes means that you should choose the best way to join the points with
NB: Read the question carefully to know exactly what you should plot on the graph (which
variables from the table)
NB: Use a key in case of plotting data for 2 categories on the same grid
NB: Do not extend the graph to the zero unless it has a point at zero
NB: Use a break if it’s impossible to apply a suitable scale (last option)
Anomalous results
This is a wrong result that happened because of a certain error
It appears as a different result from the others in a table or an off point on the graph (not with
the trend of the graph)
It can be excluded by: Repeating the experiment for more reliability