Statistics 1 for BME lectures
Lecture 1 01/02:
Descriptive statistics (chapter 1, SOWISO)
All variables can fit in two descriptions: qualitative and quantitative.
A qualitative variable is a relative variable, having no numerical representation or
categorical in nature.
A quantitative variable Is numerical in nature and measured by counting or by a
measuring instrument.
Quantitative variables can be further divided into discrete and continuous variables:
Discrete variables have a finite number of outcomes or an infinite number of
distinct outcomes.
Continuous variables have an infinite number of outcomes regardless of the
interval size.
Qualitative variables should not be listed on the x-axis with numerical representation.
Bar graphs most common representation of qualitative variables on the x-axis.
Quantitative variables have more flexibility.
Line graphs with regression are allowed.
Discrete variables should be indicated by point-by-point indications rather than a
continuous line.
In order weakest to strongest:
Nominal, ordinal, interval, and ratio.
Nominal and ordinal variables are qualitative variables:
Nominal variables are meant to classify into categories unrelated categories
that cannot be arranged or ordered in a meaningful way. Detect differences
(=).
Ordinal variables are identified by names or labels but can be arranged in a
specific way. Detect differences and direction of difference (=, < >).
Quantitative variables include interval and ratio variables:
Interval variables can be ordered like ordinal variables; however, the distances
between categories are known and equal. Detect differences, direction of
difference, size of difference (=, < >, +-).
Ratio variables are interval variables that have an absolute zero value. Detect
differences, direction of difference, size of difference and calculate ratios (=, <
>, +-, / x).
, A frequency distribution simply counts the number of occurrences of an outcome of
the variable. These counts are then plotted to demonstrate the distribution of the
data.
There are 3 distinctions that a frequency distribution describes:
Central point
Shape of distribution
Variability of the data
Frequencies can be absolute (raw count) or relative.
A bar graph is used to depict qualitative data
A histogram is used to depict quantitative data with numerical values equally
spaced on the x-axis.
An ogave is used to depict the cumulative frequency.
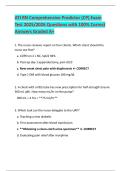
A distribution is symmetrical when the left and right side of the distribution are each
other’s mirror image. A special type of symmetrical distribution is the uniform
distribution. In a uniform distribution, all scores occur with the exact same frequency
(rectangle).
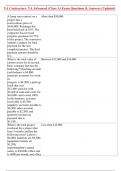
For a positively skewed distribution, the tail of the distribution points to the right side
of the scale. Large amount of low scores and few high scores.
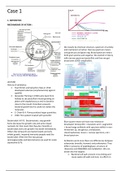
For a negatively skewed distribution, the tail of the distribution points to the left side
of the scale. Few low scores and a large number of high scores.
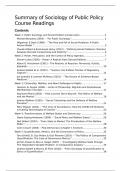
Cumulative frequencies are typically shown with a line to distinguish from frequency
distributions.
They report the frequencies of all values less than or equal to the current value in the
distribution. The nominal variable cannot be described with a cumulative frequency
because these do not have comparisons of direction.
Individual points in the distribution:
Percentiles are values that divide the distribution into 100 parts
The Pth percentile of the distribution is the value of which P% of the distribution
is equal to or lower than that value.
Find the location a percentile in a dataset:
The index of the Pth percentile of a distribution is:
i = P/100 (n-1)+1
Where n is the number of scores and P is a value between 1 and 99.
Pth percentile = Xbelow + (i-ibelow) * (Xabove-Xbelow)
Measurement of center:
The central tendency of a distribution in a dataset is used to quickly
summarize the dataset.
The mode is the value that appears most frequently. There can be more than
one mode and there can be no modes. They need to have the exact same
number.
Lecture 1 01/02:
Descriptive statistics (chapter 1, SOWISO)
All variables can fit in two descriptions: qualitative and quantitative.
A qualitative variable is a relative variable, having no numerical representation or
categorical in nature.
A quantitative variable Is numerical in nature and measured by counting or by a
measuring instrument.
Quantitative variables can be further divided into discrete and continuous variables:
Discrete variables have a finite number of outcomes or an infinite number of
distinct outcomes.
Continuous variables have an infinite number of outcomes regardless of the
interval size.
Qualitative variables should not be listed on the x-axis with numerical representation.
Bar graphs most common representation of qualitative variables on the x-axis.
Quantitative variables have more flexibility.
Line graphs with regression are allowed.
Discrete variables should be indicated by point-by-point indications rather than a
continuous line.
In order weakest to strongest:
Nominal, ordinal, interval, and ratio.
Nominal and ordinal variables are qualitative variables:
Nominal variables are meant to classify into categories unrelated categories
that cannot be arranged or ordered in a meaningful way. Detect differences
(=).
Ordinal variables are identified by names or labels but can be arranged in a
specific way. Detect differences and direction of difference (=, < >).
Quantitative variables include interval and ratio variables:
Interval variables can be ordered like ordinal variables; however, the distances
between categories are known and equal. Detect differences, direction of
difference, size of difference (=, < >, +-).
Ratio variables are interval variables that have an absolute zero value. Detect
differences, direction of difference, size of difference and calculate ratios (=, <
>, +-, / x).
, A frequency distribution simply counts the number of occurrences of an outcome of
the variable. These counts are then plotted to demonstrate the distribution of the
data.
There are 3 distinctions that a frequency distribution describes:
Central point
Shape of distribution
Variability of the data
Frequencies can be absolute (raw count) or relative.
A bar graph is used to depict qualitative data
A histogram is used to depict quantitative data with numerical values equally
spaced on the x-axis.
An ogave is used to depict the cumulative frequency.
A distribution is symmetrical when the left and right side of the distribution are each
other’s mirror image. A special type of symmetrical distribution is the uniform
distribution. In a uniform distribution, all scores occur with the exact same frequency
(rectangle).
For a positively skewed distribution, the tail of the distribution points to the right side
of the scale. Large amount of low scores and few high scores.
For a negatively skewed distribution, the tail of the distribution points to the left side
of the scale. Few low scores and a large number of high scores.
Cumulative frequencies are typically shown with a line to distinguish from frequency
distributions.
They report the frequencies of all values less than or equal to the current value in the
distribution. The nominal variable cannot be described with a cumulative frequency
because these do not have comparisons of direction.
Individual points in the distribution:
Percentiles are values that divide the distribution into 100 parts
The Pth percentile of the distribution is the value of which P% of the distribution
is equal to or lower than that value.
Find the location a percentile in a dataset:
The index of the Pth percentile of a distribution is:
i = P/100 (n-1)+1
Where n is the number of scores and P is a value between 1 and 99.
Pth percentile = Xbelow + (i-ibelow) * (Xabove-Xbelow)
Measurement of center:
The central tendency of a distribution in a dataset is used to quickly
summarize the dataset.
The mode is the value that appears most frequently. There can be more than
one mode and there can be no modes. They need to have the exact same
number.