M. Medema
Advanced Research Methods and Statistics for Psychology
General part 2020-2021
SPSS Skills Exam - Grasple Lessons
Refresh - Linear Regression
Simple Linear Regression - Correlation
Simple linear regression means a model with only 1 independent variable (predictor).
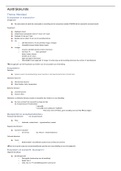
The relationship between these 2 variables =
Strong Negative Linear Relationship
It can sometimes be difficult to see the strength of a relationship only by eye. Therefore, you have a
standardized number to assess the strength of a linear relationship, called the correlation coefficient,
also called Pearson’s R.
● An absolute value of 1 indicates maximum strength of a relation between two variables
● A value of 0 indicates no linear relation between the two variables
The correlation is a standardized measure, and multiple strengths of relationships can be compared
because of that. However, a low correlation or a correlation of 0 does not mean that there is no relation
between the two variables. The relationship can also be non-linear.
The correlation does not mean that the movement in 1 variable causes the other variable to move as
well. A correlation describes the strength of the linear relationship, not the causal effects of the
variables.
A variable has to be measured at interval/ratio level, otherwise it cannot be used to calculate
correlations.
,When you want to investigate whether there are relationships between different variables, you can first
draw a scatter plot, this provides you with valuable information about the strength and the direction of
the relationship.
If you want to compare correlations, the best option is to calculate Pearson’s R, because it is always
between -1 and 1, so that makes it easy to compare the correlations.
Pearson’s R will not give a good value for the strength of this combination of
variables, because it is non-linear.
If two variables are correlated this means that a change in one of the variables will also mean a change
in the other variable. Whether one variable is the cause of the change in the other variable cannot be
concluded based on a correlation. To check this, you would need to set up an experiment. An
experiment is required to establish that there is a cause-effect relationship because this way other
explanations can be ruled out.
If 2 variables are correlated, this means that changes in 1 variable vary along
with changes in the other variable.
In essence, linear regression boils down to summarising a bunch of data by
drawing a straight line through them. The straight line is used to predict the
value of one variable based on the value of the other variable.
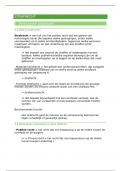
Note that, although the line in the second plot is the best fitting linear line through these data, it does
not represent the relation between the 2 variables very well (a straight line is not able to capture the
non-linear relation that we observe).
The minimal measurement level required for a linear regression is interval (quantitative variables)
Regression equation
If you want to calculate the predicted value, you need the regression equation. The first thing you
need to calculate is the slope of the line.
Y/X = Slope
So this is how we should interpret the slope:
An increase in X by one unit results in an increase or decrease in Y of how
many units?
Example: if a person ages 1 extra year, their blood pressure rises on
average by 0.25 ps.
,Intercept
After calculating the slope, you have to calculate the intercept, this is the point where the regression
line crosses the y-axis. This way you know where to place the beginning of the line on the y-axis.
Now that we know the line's two essential components, we can use these to make predictions:
Y-value = intercept + slope 𝘅 X-value
Mathematical formula=
ŷ = b0 +
b1x
1. Calculate slope
2. Calculate the intercept
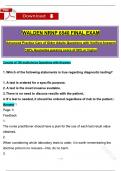
In this plot, you see 3 black dots representing 3 persons scoring the
same on x. Are the observed and predicted y values also the same for
these 3 persons?
The predicted Y values are the same, but the observed Y values are
different.
The predicted value is the corresponding y-value on the regression
line (in the graph called expected value) and this is the same for all
people with the same score on x. The observed values for y are not on
the regression line and differ for the 3 persons (3 dots with different
y-values).
The distance between the true y value and the predicted value ŷ is called the
error or residual.
Y - ŷ = error
Sometimes there might be a problem; the positive and negative errors can cancel each other. This
makes the sum of all errors 0.
When we square the errors, they will always be positive and they do not cancel each other. This way
we can look for the line that will result in the smallest possible sum of squared errors.
This method is called the least squares method. This method is used to estimate the parameters of
the linear regression model. With this method we can find a linear regression model which fits the data
best.
, To reduce the sum of squared errors Σ (y-ŷ)² to a minimum, you have the following formula, which
determines the slope of the line with the smallest sum of squared errors:
σy
b1 = r 𝘅
σx
So the slope equals the correlation coefficient (pearson's r) times the standard deviation of y divided by
the standard deviation of x.
R-squared
Goodness of fit = R² (R-squared)
The R² determines the proportion of the variance of the dependent variable that is ‘explained’ by the
predictor variable(s). The R² is a proportion between 0 and 1.
So as an example: R² is 0.56, this means 56% of the variance of X (dependent) is explained by Y
(independent).
If the R² is very small, this does not mean that there is no meaningful relationship between the
variables, the relationship could still be practically relevant, even though it does not explain a large
amount of the variance.
If the R² is very large, this does not mean that the model is useful for predicting new observations. A
very large R² could be due to the sample, and might not predict well in a different sample.
Ŷ = b0 + (b1 * X 1 )
b0 = Estimated intercept
b1 = Estimated slope
X1 = Score independent variable (predictor)
If there are 2 independent variables, the formula is:
Ŷ = b0 + (b1 * X 1 ) + (b2 * X 2 )
So if you want to calculate the residual for a participant:
Y − (b0 + (b1 * X 1 ) + (b2 * X 2 ))
Advanced Research Methods and Statistics for Psychology
General part 2020-2021
SPSS Skills Exam - Grasple Lessons
Refresh - Linear Regression
Simple Linear Regression - Correlation
Simple linear regression means a model with only 1 independent variable (predictor).
The relationship between these 2 variables =
Strong Negative Linear Relationship
It can sometimes be difficult to see the strength of a relationship only by eye. Therefore, you have a
standardized number to assess the strength of a linear relationship, called the correlation coefficient,
also called Pearson’s R.
● An absolute value of 1 indicates maximum strength of a relation between two variables
● A value of 0 indicates no linear relation between the two variables
The correlation is a standardized measure, and multiple strengths of relationships can be compared
because of that. However, a low correlation or a correlation of 0 does not mean that there is no relation
between the two variables. The relationship can also be non-linear.
The correlation does not mean that the movement in 1 variable causes the other variable to move as
well. A correlation describes the strength of the linear relationship, not the causal effects of the
variables.
A variable has to be measured at interval/ratio level, otherwise it cannot be used to calculate
correlations.
,When you want to investigate whether there are relationships between different variables, you can first
draw a scatter plot, this provides you with valuable information about the strength and the direction of
the relationship.
If you want to compare correlations, the best option is to calculate Pearson’s R, because it is always
between -1 and 1, so that makes it easy to compare the correlations.
Pearson’s R will not give a good value for the strength of this combination of
variables, because it is non-linear.
If two variables are correlated this means that a change in one of the variables will also mean a change
in the other variable. Whether one variable is the cause of the change in the other variable cannot be
concluded based on a correlation. To check this, you would need to set up an experiment. An
experiment is required to establish that there is a cause-effect relationship because this way other
explanations can be ruled out.
If 2 variables are correlated, this means that changes in 1 variable vary along
with changes in the other variable.
In essence, linear regression boils down to summarising a bunch of data by
drawing a straight line through them. The straight line is used to predict the
value of one variable based on the value of the other variable.
Note that, although the line in the second plot is the best fitting linear line through these data, it does
not represent the relation between the 2 variables very well (a straight line is not able to capture the
non-linear relation that we observe).
The minimal measurement level required for a linear regression is interval (quantitative variables)
Regression equation
If you want to calculate the predicted value, you need the regression equation. The first thing you
need to calculate is the slope of the line.
Y/X = Slope
So this is how we should interpret the slope:
An increase in X by one unit results in an increase or decrease in Y of how
many units?
Example: if a person ages 1 extra year, their blood pressure rises on
average by 0.25 ps.
,Intercept
After calculating the slope, you have to calculate the intercept, this is the point where the regression
line crosses the y-axis. This way you know where to place the beginning of the line on the y-axis.
Now that we know the line's two essential components, we can use these to make predictions:
Y-value = intercept + slope 𝘅 X-value
Mathematical formula=
ŷ = b0 +
b1x
1. Calculate slope
2. Calculate the intercept
In this plot, you see 3 black dots representing 3 persons scoring the
same on x. Are the observed and predicted y values also the same for
these 3 persons?
The predicted Y values are the same, but the observed Y values are
different.
The predicted value is the corresponding y-value on the regression
line (in the graph called expected value) and this is the same for all
people with the same score on x. The observed values for y are not on
the regression line and differ for the 3 persons (3 dots with different
y-values).
The distance between the true y value and the predicted value ŷ is called the
error or residual.
Y - ŷ = error
Sometimes there might be a problem; the positive and negative errors can cancel each other. This
makes the sum of all errors 0.
When we square the errors, they will always be positive and they do not cancel each other. This way
we can look for the line that will result in the smallest possible sum of squared errors.
This method is called the least squares method. This method is used to estimate the parameters of
the linear regression model. With this method we can find a linear regression model which fits the data
best.
, To reduce the sum of squared errors Σ (y-ŷ)² to a minimum, you have the following formula, which
determines the slope of the line with the smallest sum of squared errors:
σy
b1 = r 𝘅
σx
So the slope equals the correlation coefficient (pearson's r) times the standard deviation of y divided by
the standard deviation of x.
R-squared
Goodness of fit = R² (R-squared)
The R² determines the proportion of the variance of the dependent variable that is ‘explained’ by the
predictor variable(s). The R² is a proportion between 0 and 1.
So as an example: R² is 0.56, this means 56% of the variance of X (dependent) is explained by Y
(independent).
If the R² is very small, this does not mean that there is no meaningful relationship between the
variables, the relationship could still be practically relevant, even though it does not explain a large
amount of the variance.
If the R² is very large, this does not mean that the model is useful for predicting new observations. A
very large R² could be due to the sample, and might not predict well in a different sample.
Ŷ = b0 + (b1 * X 1 )
b0 = Estimated intercept
b1 = Estimated slope
X1 = Score independent variable (predictor)
If there are 2 independent variables, the formula is:
Ŷ = b0 + (b1 * X 1 ) + (b2 * X 2 )
So if you want to calculate the residual for a participant:
Y − (b0 + (b1 * X 1 ) + (b2 * X 2 ))