STA1510
EXAM PACK
FOR ASSISTANCE WITH THIS MODULE +27 67 171 1739
,STA1510
STA1510 OCTOBER
ASSIGNMENT PACK NOVEMBER EXAM
A.1 Assignment 01
QUESTION 1
The following stem–and–leaf display gives the scores of a sample of 30 students on a statistics exam
5 0 2 7
6 1 5 4 9 8
7 1 1 2 5 2 6 7 9 9
8 0 1 3 4 7 7 7
9 6 8 2 3 2 5
Which statement is incorrect?
1. The median is equal to 78.
2. The mode is equal to 87:
3. 43:33% of the students scored above 80%
4. The range is equal to 48:
5. 10% of the students scored less than 60%
QUESTION 2
Consider the following data set:
33 29 45 60 42 19 52 38 36
Which one of the following statements is incorrect?
N
1. The mean, X D 39:3333:
2. The median is 38:
3. The data distribution is negatively skewed.
4. There is no mode.
5. The coefficient of variation is equal to 31:14%
QUESTION 3
In perfectly symmetric distributions which of the following is NOT a correct statement?
1. The distance from the smallest observation to Q2 is the same as the distance from Q2 to the largest
observations.
2. The mean is equal to the median.
3. The distance from Q1 to Q3 is half of the distance from the smallest to the largest observation.
, 4. The distance from Q1 to Q2 equals to the distance from Q2 to Q3.
5. The distance from the smallest observation to Q1 is the same as the distance from Q3 to the largest
observation.
QUESTION 4
In measuring the centre of the data from a positively skewed distribution, the median would be preferred
over the mean for most purposes because:
1. The median is the most frequent number while the mean is most likely:
2. The mean may be too heavily influenced by the larger observations and this gives too high an
indication of the centre.
3. The median is less than the mean and smaller numbers are always appropriate for the centre.
4. The mean measures the spread in the data.
5. The median measures the arithmetic average of the data excluding outliers.
QUESTION 5
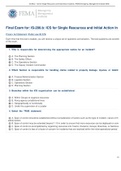
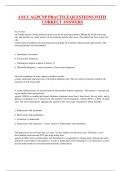
The figure below shows the histogram of the numeric frequency distribution for shoppers’ ages.
12
9
8
Number 6
of 6
Shoppers 4
3
0
_ _ _ _ _
20 <30 <40 <50 <60 <70
Age intervals (in years)
, What is the most frequent age interval of shoppers surveyed?
1. between 20 and 39 years
2. between 30 and 39 years
3. between 20 and 29 years
4. between 30 and 49 years
5. between 60 and 69 years
QUESTION 6
1. Refer to the information in Question 5. What percentage of shoppers belong to the most frequent age
interval?
2. 30%
3. 26:67%
4. 20%
5. 10%
6. 100%
QUESTION 7
Which one of the following statements is incorrect?
1. A random variable is any attribute of interest on which data is collected and analysed.
2. Ordinal data are categorical data that has an implied ranking.
3. A sample statistic is a measure that describes a characteristic of a sample.
4. Ratio data are categorical data with all categories having equal importance.
5. Continuous data is any number that can occur in an interval.
QUESTION 8
Fill in the missing words to the quote: “statistical methods may be described as methods for drawing
conclusions about ________ based on ________ computed from the ________”.
1. statistics, samples, populations
2. populations, parameters, samples
3. statistics, parameters, samples
4. parameters, statistics, populations
EXAM PACK
FOR ASSISTANCE WITH THIS MODULE +27 67 171 1739
,STA1510
STA1510 OCTOBER
ASSIGNMENT PACK NOVEMBER EXAM
A.1 Assignment 01
QUESTION 1
The following stem–and–leaf display gives the scores of a sample of 30 students on a statistics exam
5 0 2 7
6 1 5 4 9 8
7 1 1 2 5 2 6 7 9 9
8 0 1 3 4 7 7 7
9 6 8 2 3 2 5
Which statement is incorrect?
1. The median is equal to 78.
2. The mode is equal to 87:
3. 43:33% of the students scored above 80%
4. The range is equal to 48:
5. 10% of the students scored less than 60%
QUESTION 2
Consider the following data set:
33 29 45 60 42 19 52 38 36
Which one of the following statements is incorrect?
N
1. The mean, X D 39:3333:
2. The median is 38:
3. The data distribution is negatively skewed.
4. There is no mode.
5. The coefficient of variation is equal to 31:14%
QUESTION 3
In perfectly symmetric distributions which of the following is NOT a correct statement?
1. The distance from the smallest observation to Q2 is the same as the distance from Q2 to the largest
observations.
2. The mean is equal to the median.
3. The distance from Q1 to Q3 is half of the distance from the smallest to the largest observation.
, 4. The distance from Q1 to Q2 equals to the distance from Q2 to Q3.
5. The distance from the smallest observation to Q1 is the same as the distance from Q3 to the largest
observation.
QUESTION 4
In measuring the centre of the data from a positively skewed distribution, the median would be preferred
over the mean for most purposes because:
1. The median is the most frequent number while the mean is most likely:
2. The mean may be too heavily influenced by the larger observations and this gives too high an
indication of the centre.
3. The median is less than the mean and smaller numbers are always appropriate for the centre.
4. The mean measures the spread in the data.
5. The median measures the arithmetic average of the data excluding outliers.
QUESTION 5
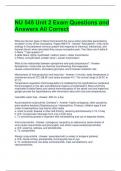
The figure below shows the histogram of the numeric frequency distribution for shoppers’ ages.
12
9
8
Number 6
of 6
Shoppers 4
3
0
_ _ _ _ _
20 <30 <40 <50 <60 <70
Age intervals (in years)
, What is the most frequent age interval of shoppers surveyed?
1. between 20 and 39 years
2. between 30 and 39 years
3. between 20 and 29 years
4. between 30 and 49 years
5. between 60 and 69 years
QUESTION 6
1. Refer to the information in Question 5. What percentage of shoppers belong to the most frequent age
interval?
2. 30%
3. 26:67%
4. 20%
5. 10%
6. 100%
QUESTION 7
Which one of the following statements is incorrect?
1. A random variable is any attribute of interest on which data is collected and analysed.
2. Ordinal data are categorical data that has an implied ranking.
3. A sample statistic is a measure that describes a characteristic of a sample.
4. Ratio data are categorical data with all categories having equal importance.
5. Continuous data is any number that can occur in an interval.
QUESTION 8
Fill in the missing words to the quote: “statistical methods may be described as methods for drawing
conclusions about ________ based on ________ computed from the ________”.
1. statistics, samples, populations
2. populations, parameters, samples
3. statistics, parameters, samples
4. parameters, statistics, populations