HC 1: Multiple linear regression 10-02-2021 H9, H11.5
The birth order effect:
Scientific research has demonstrated that firstborns have higher IQ than laterborns
But it’s important to investigate how they found this relation. So, is it true?
So, Galton (1874) noticed that the number of firstborns among eminent scientists was
remarkably large. Researchers then started to study relation birth order with IQ, and
observed a significant positive relation. But does this imply a real effect of birth order on IQ?
We have to critically review the way the studies were performed, think of: representative
sample? Reliable measures? Correct analyses? (statistical validity). We also have to critically
consider alternative explanations for the statistical association, because association is not
causation! And does this effect remain when additional variables are included?
Adding variables: a quick replay of last year
Simple linear regression involves 1 outcome (Y) and 1 predictor (X)
– Outcome = DV = dependent variable = e.g. IQ
– Predictor = IV = independent variable = e.g. birth order
Multiple linear regression involves 1 outcome and multiple predictors
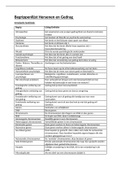
It’s important to know to what extent does the model/equation explain
variation in the data, you can see this on a plot and with R2. The line is our
model/prediction.
The slope of the regression line (B1) is also important. The larger the
slope, the steeper the line.
Multiple linear regression examines a model where multiple are included
to check their unique linear effect on Y.
Things you need to know about MLR you learn this semester:
A. The model
B. Types of variables in MLR
C. MLR and Hierarchical MLR
1. Hypotheses
2. Output
3. Model fit: R2, adjusted R2, and R2-change.
4. Regression coefficients: B and Beta (=standardized B)
D. Exploratory MLR (stepwise) versus confirmatory MLR (forced entry)
E. Model assumptions important to MLR (see Grasple)
A. The model
this is called an additive linear model, we just add x2 to x1
and so on. Next week we look at interactions of x: do x1 and x2 jointly something more than
separately if you just add them up.
Y with a ^ is prediction, Y is observed.
, B. Types of variables
We have 4 measurement levels:
- Nominal
- Ordinal
- Interval
- Ratio
For choice of analysis we usually distinguish:
– “Nominal + Ordinal” = categorical or qualitative
– “Interval + Ratio” = continuous or quantitative or numerical
→ MLR requires continuous outcome and continuous predictors, but categorical predictors
can be included as dummy variables.
Dummy coding
e.g.: Is gender a predictor of grade?
– Grade on scale 0-10 where numbers have numerical meaning. OK!
– Gender coded as: 1 = male; 2 = female. This is categorical and not numerical. Not OK!
– Dummy variable has only values 0 and 1
Female = 0, Male = 1
Now you can fill in the equation! B1 is exactly the difference
between male and female.
Categorical predictors with more than 2 levels, e.g. variable Colour:
You don’t give yellow a ‘1’, because it’s in order: if red, blue and green hive the answer ‘0’,
then you know it must be yellow that predicts something.
C. MLR and hierarchical MLR
Example: What makes old people happy?
MLR: Research question 1: Can Life Satisfaction (y) be predicted from age (x1) and years of
education (x2). These are all continuous variables, so that’s
good!
Hierarchical MLR: Research question 2: Are social network
factors (as measured by child support (x3) and spouse support (x4) improving the prediction
of Life Satisfaction, if the effects of age and years of education are already accounted for.
So: is the addition useful? We already have x1 and x2 and they work!
The birth order effect:
Scientific research has demonstrated that firstborns have higher IQ than laterborns
But it’s important to investigate how they found this relation. So, is it true?
So, Galton (1874) noticed that the number of firstborns among eminent scientists was
remarkably large. Researchers then started to study relation birth order with IQ, and
observed a significant positive relation. But does this imply a real effect of birth order on IQ?
We have to critically review the way the studies were performed, think of: representative
sample? Reliable measures? Correct analyses? (statistical validity). We also have to critically
consider alternative explanations for the statistical association, because association is not
causation! And does this effect remain when additional variables are included?
Adding variables: a quick replay of last year
Simple linear regression involves 1 outcome (Y) and 1 predictor (X)
– Outcome = DV = dependent variable = e.g. IQ
– Predictor = IV = independent variable = e.g. birth order
Multiple linear regression involves 1 outcome and multiple predictors
It’s important to know to what extent does the model/equation explain
variation in the data, you can see this on a plot and with R2. The line is our
model/prediction.
The slope of the regression line (B1) is also important. The larger the
slope, the steeper the line.
Multiple linear regression examines a model where multiple are included
to check their unique linear effect on Y.
Things you need to know about MLR you learn this semester:
A. The model
B. Types of variables in MLR
C. MLR and Hierarchical MLR
1. Hypotheses
2. Output
3. Model fit: R2, adjusted R2, and R2-change.
4. Regression coefficients: B and Beta (=standardized B)
D. Exploratory MLR (stepwise) versus confirmatory MLR (forced entry)
E. Model assumptions important to MLR (see Grasple)
A. The model
this is called an additive linear model, we just add x2 to x1
and so on. Next week we look at interactions of x: do x1 and x2 jointly something more than
separately if you just add them up.
Y with a ^ is prediction, Y is observed.
, B. Types of variables
We have 4 measurement levels:
- Nominal
- Ordinal
- Interval
- Ratio
For choice of analysis we usually distinguish:
– “Nominal + Ordinal” = categorical or qualitative
– “Interval + Ratio” = continuous or quantitative or numerical
→ MLR requires continuous outcome and continuous predictors, but categorical predictors
can be included as dummy variables.
Dummy coding
e.g.: Is gender a predictor of grade?
– Grade on scale 0-10 where numbers have numerical meaning. OK!
– Gender coded as: 1 = male; 2 = female. This is categorical and not numerical. Not OK!
– Dummy variable has only values 0 and 1
Female = 0, Male = 1
Now you can fill in the equation! B1 is exactly the difference
between male and female.
Categorical predictors with more than 2 levels, e.g. variable Colour:
You don’t give yellow a ‘1’, because it’s in order: if red, blue and green hive the answer ‘0’,
then you know it must be yellow that predicts something.
C. MLR and hierarchical MLR
Example: What makes old people happy?
MLR: Research question 1: Can Life Satisfaction (y) be predicted from age (x1) and years of
education (x2). These are all continuous variables, so that’s
good!
Hierarchical MLR: Research question 2: Are social network
factors (as measured by child support (x3) and spouse support (x4) improving the prediction
of Life Satisfaction, if the effects of age and years of education are already accounted for.
So: is the addition useful? We already have x1 and x2 and they work!