1
NEU 311L Midterm Questions with Answers (100%
Correct Answers)
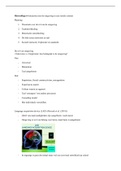
spectrogram Answer: graph that measures time vs frequency- colored
graph
PSD plot Answer: graph that measures frequency vs amplitude- graphs
the waves
what does the colored bar on the side of the spectrogram measure?
Answer: amplitude
what do the pink splotches in the back of the spectrogram represent?
Answer: noise
what is the x axis of a spectrogram? Answer: time (seconds or minutes)
what is the y axis of a spectrogram? Answer: frequency (Hz)
what is the x axis of a PSD plot? Answer: frequency (Hz)
what is the y axis of a PSD plot? Answer: amplitude (mV or uV)
© 2025 All rights reserved
, 2
what does the color represent in the spectrogram? Answer: amplitude
or power (mV or uV)
where are we likely to see alpha waves? Answer: 10 Hz
can spectrograms and PSD plots be matched together? Answer: yes
what do EEG values represent? (6-80 Hz) Answer: firing rate
high frequency/ high amplitude waves will look like what? Answer: lots
of waves that are very tall and narrow- like very tall hills and steep
valleys
low frequency/ low amplitude waves will look like what? Answer: only a
couple of waves, which are very short and long. not tall or steep-
almost a straight line
how do you convert EEG amplitude into power? Answer: square the
value of amplitude
which conditions in the fly PD model contained DMSO Answer: all of
the conditions
rotenone effects: Answer: impairs mitochondria
© 2025 All rights reserved
NEU 311L Midterm Questions with Answers (100%
Correct Answers)
spectrogram Answer: graph that measures time vs frequency- colored
graph
PSD plot Answer: graph that measures frequency vs amplitude- graphs
the waves
what does the colored bar on the side of the spectrogram measure?
Answer: amplitude
what do the pink splotches in the back of the spectrogram represent?
Answer: noise
what is the x axis of a spectrogram? Answer: time (seconds or minutes)
what is the y axis of a spectrogram? Answer: frequency (Hz)
what is the x axis of a PSD plot? Answer: frequency (Hz)
what is the y axis of a PSD plot? Answer: amplitude (mV or uV)
© 2025 All rights reserved
, 2
what does the color represent in the spectrogram? Answer: amplitude
or power (mV or uV)
where are we likely to see alpha waves? Answer: 10 Hz
can spectrograms and PSD plots be matched together? Answer: yes
what do EEG values represent? (6-80 Hz) Answer: firing rate
high frequency/ high amplitude waves will look like what? Answer: lots
of waves that are very tall and narrow- like very tall hills and steep
valleys
low frequency/ low amplitude waves will look like what? Answer: only a
couple of waves, which are very short and long. not tall or steep-
almost a straight line
how do you convert EEG amplitude into power? Answer: square the
value of amplitude
which conditions in the fly PD model contained DMSO Answer: all of
the conditions
rotenone effects: Answer: impairs mitochondria
© 2025 All rights reserved