Network Analytics – Study Notes &
Extended Summary
1. What is Network Analytics?
Network analytics studies data that can be represented as a network (graph):
● Nodes (vertices) represent entities (people, cities, web pages, products)
● Edges (links) represent relationships (friendship, roads, hyperlinks, similarity)
Many complex systems are naturally networks:
● Social networks (people ↔ people)
● Transportation networks (cities ↔ routes)
● Information networks (web pages ↔ links)
● Biological networks (proteins ↔ interactions)
The key question is often:
Who or what is important, central, influential, or structurally critical in the
network?
2. Birth of Graph Theory: Königsberg Bridges
The classical example is the Königsberg bridge problem:
● Can you walk through the city and cross each bridge exactly once?
Leonhard Euler (1736):
● Represented the city as a graph
● Proved mathematically that it was impossible
● This marked the birth of graph theory
Key insight: Real‑world problems can be abstracted into nodes and edges, revealing hidden
structure.
, 3. Types of Networks
Networks differ depending on constraints and information stored.
3.1 Directed vs. Undirected
● Undirected: relationship is mutual
○ Example: friendship
● Directed: relationship has direction
○ Example: web link A → B
If you have ONE directed edge, you have a DIRECTED network
Formally:
● Undirected edge: {u, v}
● Directed edge: (u, v)
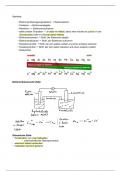
3.2 Weighted vs. Unweighted
● Unweighted: edge exists or not: binary indication (0/1)
=> All connections are treated as equally important
● Weighted: edge has a value
thick stripe: more weight
○ Distance
○ Strength
○ Similarity
Examples:
● Road network: travel time as weight
● Social network: frequency of contact
3.3 Homogeneous vs. Heterogeneous
● Homogeneous network: all nodes/edges are of the same type
● Heterogeneous network: different types of nodes and/or edges
Example: heterogenous network
one node type and multiple edge types ⇔ one edge type and multiple node type
Extended Summary
1. What is Network Analytics?
Network analytics studies data that can be represented as a network (graph):
● Nodes (vertices) represent entities (people, cities, web pages, products)
● Edges (links) represent relationships (friendship, roads, hyperlinks, similarity)
Many complex systems are naturally networks:
● Social networks (people ↔ people)
● Transportation networks (cities ↔ routes)
● Information networks (web pages ↔ links)
● Biological networks (proteins ↔ interactions)
The key question is often:
Who or what is important, central, influential, or structurally critical in the
network?
2. Birth of Graph Theory: Königsberg Bridges
The classical example is the Königsberg bridge problem:
● Can you walk through the city and cross each bridge exactly once?
Leonhard Euler (1736):
● Represented the city as a graph
● Proved mathematically that it was impossible
● This marked the birth of graph theory
Key insight: Real‑world problems can be abstracted into nodes and edges, revealing hidden
structure.
, 3. Types of Networks
Networks differ depending on constraints and information stored.
3.1 Directed vs. Undirected
● Undirected: relationship is mutual
○ Example: friendship
● Directed: relationship has direction
○ Example: web link A → B
If you have ONE directed edge, you have a DIRECTED network
Formally:
● Undirected edge: {u, v}
● Directed edge: (u, v)
3.2 Weighted vs. Unweighted
● Unweighted: edge exists or not: binary indication (0/1)
=> All connections are treated as equally important
● Weighted: edge has a value
thick stripe: more weight
○ Distance
○ Strength
○ Similarity
Examples:
● Road network: travel time as weight
● Social network: frequency of contact
3.3 Homogeneous vs. Heterogeneous
● Homogeneous network: all nodes/edges are of the same type
● Heterogeneous network: different types of nodes and/or edges
Example: heterogenous network
one node type and multiple edge types ⇔ one edge type and multiple node type