Week 8 questions and answers
Performing Linear Regressions with Technology
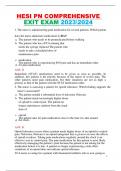
An amateur astronomer is researching statistical properties of known stars using a
variety of databases. They collect the absolute magnitude or MV and stellar mass
or M for 30 stars. The absolute magnitude of a star is the intensity of light that would
be observed from the star at a distance of 10 parsecs from the star. This is measured
in terms of a particular band of the light spectrum, indicated by the subscript letter,
which in this case is V for the visual light spectrum. The scale is logarithmic and
an MV that is 1 less than another comes from a star that is 10 times more luminous
than the other. The stellar mass of a star is how many times the sun's mass it has. The
data is provided below. Use Excel to calculate the correlation coefficient r between the
two data sets, rounding to two decimal places.
Correct! You nailed it.
r= −0.93
Answer Explanation
The correlation coefficient, rounded to two decimal places, is r≈−0.93.
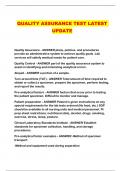
A market researcher looked at the quarterly sales revenue for a large e-commerce store
and for a large brick-and-mortar retailer over the same period. The researcher recorded
the revenue in millions of dollars for 30 quarters. The data are provided below. Use
Excel to calculate the correlation coefficient r between the two data sets. Round your
answer to two decimal places.
Yes that's right. Keep it up!
r= −0.81
Answer Explanation
The correlation coefficient, rounded to two decimal places, is r≈−0.81.
Performing Linear Regressions with Technology
An amateur astronomer is researching statistical properties of known stars using a
variety of databases. They collect the absolute magnitude or MV and stellar mass
or M for 30 stars. The absolute magnitude of a star is the intensity of light that would
be observed from the star at a distance of 10 parsecs from the star. This is measured
in terms of a particular band of the light spectrum, indicated by the subscript letter,
which in this case is V for the visual light spectrum. The scale is logarithmic and
an MV that is 1 less than another comes from a star that is 10 times more luminous
than the other. The stellar mass of a star is how many times the sun's mass it has. The
data is provided below. Use Excel to calculate the correlation coefficient r between the
two data sets, rounding to two decimal places.
Correct! You nailed it.
r= −0.93
Answer Explanation
The correlation coefficient, rounded to two decimal places, is r≈−0.93.
A market researcher looked at the quarterly sales revenue for a large e-commerce store
and for a large brick-and-mortar retailer over the same period. The researcher recorded
the revenue in millions of dollars for 30 quarters. The data are provided below. Use
Excel to calculate the correlation coefficient r between the two data sets. Round your
answer to two decimal places.
Yes that's right. Keep it up!
r= −0.81
Answer Explanation
The correlation coefficient, rounded to two decimal places, is r≈−0.81.