Statistics notes:
Lecture 1 - Data Types and Summary Statistics:
Victoria Cornelius
Types of statistics:
1. Descriptive statistics – Describe and summarise key features of the dataset
2. Inferential statistics – Have a population and take a random sample to draw
conclusions about the population
Types of data:
Many types of data can be collected. For example hospital manager wants to know
about who is attending A&E and how the service is performing.
Variable of interest to monitor may include:
o Gender
o Age
o Hour of arrival
o Length of stay
o Presenting condition
o Long-term health condition
Need to know what the variable type is:
(Numerical variables can be either continuous or discrete).
1. Continuous variables – can take an infinite number of values e.g. height.
2. Discrete – can take a limited number of discrete values which are usually
whole numbers e.g. number of children.
3. Categorical – Ordinal (an ordering) e.g. stage of cancer, nominal (in name
only) e.g. blood group and binary (two categories) e.g. gender.
Graphs:
Continuous data – histogram. Often use density scale meaning that it has been
rescaled so the total area of the bars is equal to 1. Area of bar (height X width) is
equal to the Lecture of being in that bar.
Continuous data – box plot. Useful for depicting the centre of distribution, variability
and outliers. Whiskers = 1.5* IQR
Categorical data – bar charts. Easy to summarise categorical variables as just count
the number of observations (counts are known as frequencies). Can also present as
relative frequencies where they are a proportion or percentage of the total number
of individuals. Can also use pie charts.
1
,Summarising data - Averages:
Mode – the most frequent value (or range of values). The mode is the only average
measure which is meaningful for nominal data.
Median – the value such that there are as many observations with values that lie
( n+1 ) th
above it as lie below it. The 50th percentile. Median =
2
Mean – the point around which observations are ‘balanced’.
When should we use the mean, median and mode?
o When the mean does not equal the median, the data are not normally
skewed.
o Use the mean when the data is normally skewed.
o Use the median when the data is skewed.
o Use the mode for nominal and ordinal variables.
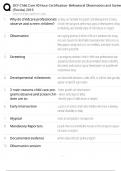
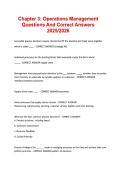
Summarising data – Measures of spread:
Spread of data: Same mean,
but different variability
(simulated length of stay
data).
Same mean for both, but
higher chance of waiting for
longer in Ipswich. They have
different variability.
Range – lowest to highest
value. Very sensitive to
outliers and so of limited use.
Maximum – minimum value.
Interquartile range (IQR)- 25th to 75th percentile. Less sensitive to outliers, but it only
uses the location of the central 50% of the observations.
( n+1 ) th 3 X ( n+1 ) th
Calculate lower quartile by and Upper quartile by
4 4
Box and whisker plots can be drawn from these values. The box is drawn from the
lower to the upper and the middle line is the median. The whiskers mark the range.
Variance – quantifying the amount of spread around the mean.
Standard deviation – square root of the variance. The standard deviation can be
seen as the average distance of an observation from the mean. The larger the SD,
the larger the variability in our data.
Summarising data:
Mean and SD are the most ‘efficient’ measures of location and spread as they use all
the data (including the values). Have nice mathematical properties, used in formal
statistical techniques.
If distribution is reasonably symmetric, use mean and SD.
Otherwise use median and IQR.
For categorical data, use mode (measures of dispersion not applicable).
Defining probability:
2
, Probability of an event: A number between 0 (impossible) and 1 (must occur)
showing how likely the event is.
The probability (P) of a particular event occurring is the ‘expectation’ of the
proportion of times the event would occur in a large number of similar trials or
situations.
Addition rule and multiplication rule:
Addition rule:
o If two events are mutually exclusive i.e. when one happens the other cannot
happen then the probability that one or the other may happen is the sum of
their probabilities.
o Rolling a one or a two = 1/6 + 1/6 = 2/6
Multiplication rule:
o If two events are independent i.e. tossing two coins as one coin does not
influence the other. You multiply the events.
Populations and Random Samples:
If our data are a random sample of population, then we can use the sample to
draw inferences about that population e.g. the probability of an asthmatic
patient being admitted to hospital
Random Sample: A sample is a random sample when all people (units) in the
population have the same chance of being selected.
Simple random sample – all combinations of people are equally likely. Therefore,
once one or more people are chosen for your sample, then each remaining
person has the same chance as every other remaining person of being selected.
Every time you take a sample, you get a slightly different distribution (when
plotting histograms).
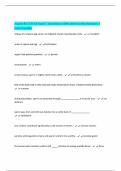
Normal distribution = “bell-shaped curve” = Gaussian Distribution:
o Many natural measurements approximate to a normal distribution e.g.
height.
o Symmetrical about the mean and bell-shaped. Tall and narrow bell for
small standard deviations and short and wide for large standard
deviations.
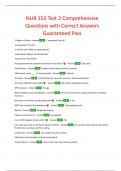
o The shape of the curve is defined by two population parameters - mean
(𝜇) and SD (σ).
o X ~ N( 𝜇, σ2)
o X is distributed normally with mean and variance
o Images show differing means and SDs.
o Area under the curve all adds up to 1.
3
, 0 1 0 3 0 0.5
0.4
0.8
0.12
Prob. density
Prob. density
Prob. density
0.2
0.4
0.06 0.00
0.0
0.0
-10 -5 0 5 10 -10 -5 0 5 10 -10 -5 0 5 10
-4 1 4 1 -1.3 2.5
0.4
0.4
Prob. density
Prob. density
Prob. density
0.10
0.2
0.2
0.00
0.0
0.0
-10 -5 0 5 10 -10 -5 0 5 10 -10 -5 0 5 10
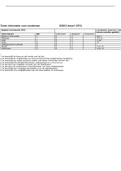
If we assume that the data follows a normal distribution, we can use the normal
distribution to estimate the probability of waiting over 240 mins in A&E.
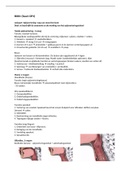
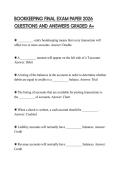
Properties of the normal distribution:
Mean
.1
68% of all observations lie within
1 SD of the mean
.08
95% of all observations lie within
2 SD of the mean
.04 .06
Density
Mean-SD Mean+SD
99.7% of all observations lie
within 3 SD of the mean Mean-2SD Mean+2SD
Assume that population mean =
174, SD = 35 mins
.02
What can we say about the
observations?
0
We expect approx. 95% of 80 90 100 110 120
Height (cm)
observations will lie +/- 2SD of
mean
e.g. 174 – 2×35 to 174 + 2×35 =
104 to 244 mins
Interpret : we expect ≈ 95% of 50 100 150 200
lengthstay
250 300
people arriving at A&E to be seen
within 104 to 244 mins (≈1hr 42
mins to 4 hours and 6 mins).
Given any mean and SD, assuming
data are normally distributed we
can say: 95% of our observations
will lies within +/- 1.96 SD of the
mean.
Standard normal probability distribution:
Sometimes we want to know if a specific observation is common or exceptional at a
glance.
4
Lecture 1 - Data Types and Summary Statistics:
Victoria Cornelius
Types of statistics:
1. Descriptive statistics – Describe and summarise key features of the dataset
2. Inferential statistics – Have a population and take a random sample to draw
conclusions about the population
Types of data:
Many types of data can be collected. For example hospital manager wants to know
about who is attending A&E and how the service is performing.
Variable of interest to monitor may include:
o Gender
o Age
o Hour of arrival
o Length of stay
o Presenting condition
o Long-term health condition
Need to know what the variable type is:
(Numerical variables can be either continuous or discrete).
1. Continuous variables – can take an infinite number of values e.g. height.
2. Discrete – can take a limited number of discrete values which are usually
whole numbers e.g. number of children.
3. Categorical – Ordinal (an ordering) e.g. stage of cancer, nominal (in name
only) e.g. blood group and binary (two categories) e.g. gender.
Graphs:
Continuous data – histogram. Often use density scale meaning that it has been
rescaled so the total area of the bars is equal to 1. Area of bar (height X width) is
equal to the Lecture of being in that bar.
Continuous data – box plot. Useful for depicting the centre of distribution, variability
and outliers. Whiskers = 1.5* IQR
Categorical data – bar charts. Easy to summarise categorical variables as just count
the number of observations (counts are known as frequencies). Can also present as
relative frequencies where they are a proportion or percentage of the total number
of individuals. Can also use pie charts.
1
,Summarising data - Averages:
Mode – the most frequent value (or range of values). The mode is the only average
measure which is meaningful for nominal data.
Median – the value such that there are as many observations with values that lie
( n+1 ) th
above it as lie below it. The 50th percentile. Median =
2
Mean – the point around which observations are ‘balanced’.
When should we use the mean, median and mode?
o When the mean does not equal the median, the data are not normally
skewed.
o Use the mean when the data is normally skewed.
o Use the median when the data is skewed.
o Use the mode for nominal and ordinal variables.
Summarising data – Measures of spread:
Spread of data: Same mean,
but different variability
(simulated length of stay
data).
Same mean for both, but
higher chance of waiting for
longer in Ipswich. They have
different variability.
Range – lowest to highest
value. Very sensitive to
outliers and so of limited use.
Maximum – minimum value.
Interquartile range (IQR)- 25th to 75th percentile. Less sensitive to outliers, but it only
uses the location of the central 50% of the observations.
( n+1 ) th 3 X ( n+1 ) th
Calculate lower quartile by and Upper quartile by
4 4
Box and whisker plots can be drawn from these values. The box is drawn from the
lower to the upper and the middle line is the median. The whiskers mark the range.
Variance – quantifying the amount of spread around the mean.
Standard deviation – square root of the variance. The standard deviation can be
seen as the average distance of an observation from the mean. The larger the SD,
the larger the variability in our data.
Summarising data:
Mean and SD are the most ‘efficient’ measures of location and spread as they use all
the data (including the values). Have nice mathematical properties, used in formal
statistical techniques.
If distribution is reasonably symmetric, use mean and SD.
Otherwise use median and IQR.
For categorical data, use mode (measures of dispersion not applicable).
Defining probability:
2
, Probability of an event: A number between 0 (impossible) and 1 (must occur)
showing how likely the event is.
The probability (P) of a particular event occurring is the ‘expectation’ of the
proportion of times the event would occur in a large number of similar trials or
situations.
Addition rule and multiplication rule:
Addition rule:
o If two events are mutually exclusive i.e. when one happens the other cannot
happen then the probability that one or the other may happen is the sum of
their probabilities.
o Rolling a one or a two = 1/6 + 1/6 = 2/6
Multiplication rule:
o If two events are independent i.e. tossing two coins as one coin does not
influence the other. You multiply the events.
Populations and Random Samples:
If our data are a random sample of population, then we can use the sample to
draw inferences about that population e.g. the probability of an asthmatic
patient being admitted to hospital
Random Sample: A sample is a random sample when all people (units) in the
population have the same chance of being selected.
Simple random sample – all combinations of people are equally likely. Therefore,
once one or more people are chosen for your sample, then each remaining
person has the same chance as every other remaining person of being selected.
Every time you take a sample, you get a slightly different distribution (when
plotting histograms).
Normal distribution = “bell-shaped curve” = Gaussian Distribution:
o Many natural measurements approximate to a normal distribution e.g.
height.
o Symmetrical about the mean and bell-shaped. Tall and narrow bell for
small standard deviations and short and wide for large standard
deviations.
o The shape of the curve is defined by two population parameters - mean
(𝜇) and SD (σ).
o X ~ N( 𝜇, σ2)
o X is distributed normally with mean and variance
o Images show differing means and SDs.
o Area under the curve all adds up to 1.
3
, 0 1 0 3 0 0.5
0.4
0.8
0.12
Prob. density
Prob. density
Prob. density
0.2
0.4
0.06 0.00
0.0
0.0
-10 -5 0 5 10 -10 -5 0 5 10 -10 -5 0 5 10
-4 1 4 1 -1.3 2.5
0.4
0.4
Prob. density
Prob. density
Prob. density
0.10
0.2
0.2
0.00
0.0
0.0
-10 -5 0 5 10 -10 -5 0 5 10 -10 -5 0 5 10
If we assume that the data follows a normal distribution, we can use the normal
distribution to estimate the probability of waiting over 240 mins in A&E.
Properties of the normal distribution:
Mean
.1
68% of all observations lie within
1 SD of the mean
.08
95% of all observations lie within
2 SD of the mean
.04 .06
Density
Mean-SD Mean+SD
99.7% of all observations lie
within 3 SD of the mean Mean-2SD Mean+2SD
Assume that population mean =
174, SD = 35 mins
.02
What can we say about the
observations?
0
We expect approx. 95% of 80 90 100 110 120
Height (cm)
observations will lie +/- 2SD of
mean
e.g. 174 – 2×35 to 174 + 2×35 =
104 to 244 mins
Interpret : we expect ≈ 95% of 50 100 150 200
lengthstay
250 300
people arriving at A&E to be seen
within 104 to 244 mins (≈1hr 42
mins to 4 hours and 6 mins).
Given any mean and SD, assuming
data are normally distributed we
can say: 95% of our observations
will lies within +/- 1.96 SD of the
mean.
Standard normal probability distribution:
Sometimes we want to know if a specific observation is common or exceptional at a
glance.
4