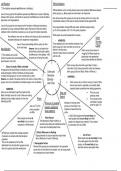
Left Realism Official Statistics
↑ (The statistics represent real differences in offending.)
Official statistics on the criminal justice process show significant differences between
Lea and Young say that the statistics represent real differences in levels of offending ethnic groups, e.g. Black people are more likely to be imprisoned.
between ethnic groups, and that this is caused by real differences in levels of relative Also shows some ethnic groups are more at risk of being victims of a crime, with
deprivation and marginalisation. considerable evidence of the scale of racially motivated crimes against EMs.
Lea and Young say that one response is the formation of delinquent subcultures,
Over-representation amongst EMs also exists, with Black people making
particularly by young, unemployed Black males. High levels of theft and robbery
up 3% of the population, but 13% of the prison population.
(utilitarian crime) is therefore produced as a way to cope with relative deprivation.
White people are under-represented in all areas.
Non-utilitarian crime such as violence and rioting can also be produced by
frustrated individuals who experience marginalisation.
Victim
- HOWEVER… Surveys,
Lea and Young acknowledge that the police can often These statistics don’t show whether members of one
ethnic group are in fact more likely to commit an CSEW
act in racist ways. However, they do not believe that
Neo-Marxism offence in the first place. Victim surveys have shown for
discriminatory policing fully explains
Instead it simply shows involvements ‘mugging’ that Black people are
↑ (The statistics are a social the differences in the statistics. >90%
with the CJS. significantly over-represented
construct resulting from racist labelling and of reports are in fact by the public.
among those identified as offenders.
discrimination in the CJS.)
Victim surveys also show that a great deal of crime is
- Gilroy: the myth of Black criminality
‘intra-ethnic’ (that it takes place within rather than between
He argued that the idea of Black criminality is a myth created by
Crime and ethnic groups; Black on Black, White on White etc.)
racist stereotypes of African Caribbean and Asian people.
In reality, these groups are no more criminal than any other. Deviance - - HOWEVER…
However, as a result of the police and the CJS’ actions, minority ethnic Ethnicity
groups come to be criminalised and therefore appear more in statistics. and Crime ● Victim surveys rely on victims’ memory of events. White
victims have shown to potentially ‘over-identify’ Black
- HOWEVER… suspects despite uncertainty when stating appearance.
Gilroy can be criticised through the simple fact that Stop and ● They only cover
Black criminality cannot be a myth if there are existing personal crimes
statistics proving a higher majority of crime and
Search
Prison ● They exclude crimes
offending by EMs. committed by people
There are 3 possible Members of minority ethnic
Just over ¼ of the groups are more likely to be under the age of 10.
reasons explaining
prison population stopped and searched by the
are EMs.
these patterns: police.
In 2020, Black people were 9x more likely and
Black people are almost 4x 1. Police Racism Asian people were 2x more likely than White
more likely to be in prison in The Macpherson Report (1999) is an people to be stopped and searched. This is backed
comparison to White people. example where there was institutional racism by information from the CSEW.
found within the Metropolitan Police.
All EMs have a higher than average proportion 2. Ethnic differences in offending
of prisoners on remand within the total prison Disproportionality in stop and searches simply reflect - Use of force
population. ethnic differences in levels of offending. Black people were 4x more likely to have
This can be explained by the fact that force used against them than White
3. Demographic factors people, and 5x more likely to have
defendants from minority ethnic groups are less Minority ethnic groups are overrepresented in the population
likely to be granted bail while awaiting trial. taser-like devices used against them.
groups who are most likely to be stopped, such as young people,
the unemployed and urban dwellers.