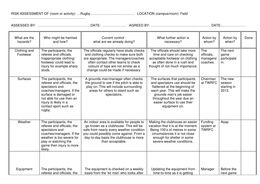
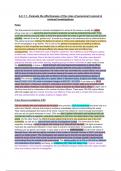
AQA Year 13 MICROECONOMICS KNOWLEDGE ORGANISER Production and Productivity
Production The relationship between TP, AP & MP
Production: the process of converting inputs, including the services of
factors of production such as capital and labour, into final output TP increases at an increasing
Inputs: these are the resources or factors of production, land, labour, capital rate as the quantity of labour
and enterprise, used in the production process rises to A = increasing returns
Output: the goods and services produced to labour; MP increases (to
Productivity: a measure of the efficiency with which inputs are transformed D)
into outputs
Labour productivity: output per worker or output per labour hour TP increases at a decreasing
rate from A to C as L
Total product, average product, marginal product increases = diminishing
Total product TP: total output of goods and services produced by a firm or a returns to labour; MP is
production process within a given period, using a specific amount of input positive but decreasing (D to
Average product AP: output per unit of input (AP = TP/L where labour L is F)
the variable factor of production)
Marginal product MP: the change in total product when one more unit of TP decreases after C as
the variable factor is added (MP = change in TP/change in L, where L is the labour increases = negative
variable factor) returns to labour; MP is
negative
Law of Diminishing Marginal Returns
Law of Diminishing Marginal Returns: as the use of one variable input AP (=TP/L) increases while
increases while others are held constant, the additional output gained will output grows faster than the
eventually diminish. labour input, i.e. up to B
Increasing returns to the variable factor: as units of the variable factor are When TP grows more slowly
added to fixed factors, total output (TP) rises at an increasing rate than L after B, AP falls.
Diminishing returns to the variable factor: as units of the variable factor are
• MP is the gradient of the TP curve
added to the fixed factor, total output (TP) increases at a decreasing rate
• MP cuts AP at its maximum: if the additional to total pr
Law of DR is a short run concept – at least one factor of production is fixed.
(MP) is greater than the average, (AP) the average will
(In the long run, all factors are variable and the scale of production can be
additional to the total is lower than the average, the av
changed)
,AQA Year 13 MICROECONOMICS KNOWLEDGE ORGANISER Short Run Costs
Short Run Costs: types, SR and LR Marginal costs
Fixed costs: costs that do not vary with output; the total costs incurred Marginal cos
when output is zero change in tot
Variable costs: costs that vary directly with output output increa
Short-run: the period of time in which at least one factor of production is unit.
fixed MC = change
Long-run: the period of time in which all factors of production are variable costs/change
Total costs in the short run • Marginal
variable c
Total fixed costs TFC do not gradient
change with output
Total variable costs The relationship between AC and MC
TVC increase as output rises,
but the relationship is not Short-run expl
DIMINISHING
linear because of the Law of variable factor
Diminishing Returns factors, the fix
Total costs TC = TFC + TVC capital) becom
scarce and ma
(from Q), caus
Average costs in the short run rise
MC always c
Average fixed costs AFC = TFC/Q; curves at the
AFC decreases with output point.
Average variable costs AVC ; the • If you ad
curve is U-shaped, at lower outputs total tha
output rises faster than TVC; at average,
higher outputs, TVC rise faster than rises; if y
output your tota
Average total costs ATC = AFC + AVC current a
average
,AQA Year 13 MICROECONOMICS KNOWLEDGE ORGANISER Long Run Costs & Economies and Diseconomies of Scale
Economies of Scale Long run average cost (LRAC) curve
In the long run, all factors of production are variable, so a firm can 'scale up'. LRAC curve is drawn assuming there is an
There can be cost advantages when operating at a larger scale known as infinite number of plant sizes that a
economies of scale or increasing returns to scale; EoS = falling long run business can use:
average costs (LRAC) • If LRAC is falling when output is
increasing, then the firm is
Internal v External Economies of Scale experiencing economies of scale.
Internal economies of scale arise because of the growth in output of the • Conversely, when LRAC eventually
firm itself as it expands its own operations; efficiencies in production are starts to rise then the firm experiences
gained reducing LRAC diseconomies of scale
External economies of scale arise from factors outside the firm because of • If LRAC is constant, the firm is
experiencing constant returns to scale
the growth in the size of the industry or the business environment in which
the firm operates, reducing LRAC for individual firms (small or large) External economies of scale; shift down in LRAC
Internal Economies of Scale
Technical EoS = use of specialised equipment, automated manufacturing; law of External EoS cause the firm's
increased dimensions e.g. containerisation, LRAC to shift down – lower
Purchasing EoS = lower price per unit from bulk buying, larger firm can use its average costs at every output
monopsony power level.
Managerial EoS = using specialist staff, a form of the division of labour, e.g. specialist
External diseconomies of scale
production manager
Financial EoS = bigger firms are often less risky and can get bigger loans at lower would shift it up
interest rates than smaller firms
Risk-bearing EoS = larger firms can diversify to spread risk; makes business more Minimum efficient scale MES)
resilient to changes in market conditions
MES: the lowest output Q
External Economies of Scale
firm is at the lowest poin
Sometimes called agglomeration economies or clustering
The business achieves pr
Infrastructure: industries cluster geographically to benefit from shared infrastructure,
e.g. Media City in Salford; fishing industry in Grimsby efficiency.
Knowledge & labour pool: in some regions there may be a strong knowledge sharing If the MES is low relative
environment e.g. City of London, Cambridge Uni & Science Park output, then it is likely th
Supplier networks: clusters of related businesses can lead to a strong supplier large number of small fir
network e.g. specialised components in automotive industry industry and vice versa
,AQA Year 13 MICROECONOMICS KNOWLEDGE ORGANISER Revenue & Profit
Revenue: AR, MR and TR, for price-makers and price-takers Profit (TR-TC = profit)
Total revenue: quantity sold x price; TR = Q x P Profit = total revenue (TR) - total costs (TC)
Average revenue: revenue per unit sold; AR = TR/Q Normal profit: the profit that the firm could make by using it
Marginal revenue: the change in TR when one more unit is sold; MR = change their next best use; it is the profit needed to keep the firm in
in TR/change in Q effectively a cost of production. Normal profit is earned when
Price-maker: a firm with some market power that can alter prices Supernormal profit: also called abnormal profit; any profit ov
Price-taker: a firm with no market power, selling at the market price only normal profit
Profit
Supernormal profit exists
when TR>TC; it is maximised
when the vertical difference
between TR and TC is
greatest
Profit maximisation MC=MR
Up to output Q, MR>MC
extra unit produced more
revenue (MR) than is add
(MC) so profit rises.
Beyond output Q, MR<M
each extra unit produced
to revenue (MR) than is a
For price makers: Marginal Revenue For price makers: Marginal Revenue costs (MC) so profit falls
(MR) is less than Average Revenue (MR) is equal to Average Revenue (AR),
(AR), because to sell additional units, because every unit is sold at exactly A common simplifying assumption is that a firm will aim t
the price of all units needs to be the same price. TR is upwards sloping its profits. (This assumption can be broken down in evalu
lowered. TR is max when MR = 0. with constant gradient. Profit-maximisation occurs at the out where MC=MR.
,AQA Year 13 MICROECONOMICS KNOWLEDGE ORGANISER Technological change & business objectives
Invention & Innovation Types of business objectives
Invention: creation of a new idea, concept, method, design or product, that is entirely Profit-maximisation: firm aim to make the maximum profit p
original or a significant improvement over existing solutions where MC = MR; this is also the loss-minimising condition)
Innovation: process of taking an invention/new idea and applying it in a way that creates
Revenue maximisation: firm aims to maximise total revenue
value, often by bringing it to the market, improving upon it, or finding new uses for it
MR = 0)
Technological Change in Production Sales growth maximisation: firm aims to have largest market
Automation: Technological advancements, such as robotics, have automated various running at a loss (occurs where AC = AR)
production processes, improving precision and efficiency. Profit satisficing: managers aim to make enough profit to sat
Digitalisation: Adoption of digital technologies streamlines production through data shareholders
analysis and real-time monitoring to optimise production schedules and detect faults early.
Increased Productivity: technologies often lead to higher output per unit of input Diagram showing different business objective
Efficiency Gains: technologies can reduce waste and resource usage; costs may be lower
and environmental impact may be reduced Profit-maximisation
Lower costs: enhanced production efficiency can result in economies of scale, lowering occurs at output Q1,
average costs. where MC=MR
Impact on Product Development and Markets Revenue maximisation
occurs at Q2, where
New products: Companies may invest in research and development (R&D) to create
innovative products. MR=0
New markets: Sales maximisation
Technological advancements can enable businesses to enter new markets. occurs are Q3, where
New industries: New technologies can give rise to entirely new industries. AC=AR
Creative Destruction: Innovation and technological advances may render existing products
or industries obsolete.
Influence of technological change on Market Structure Profit satisficing
Disruption of Traditional Markets: Innovative technologies can disrupt established market Managers can
structures. output betwee
Creation of Oligopolies: Certain technologies may lead to the dominance of a few large
firms.
depending on
Platform Markets: Technology facilitates the rise of new market structures such as because betwe
platform-based markets such as App stores and social media platforms output levels,
Globalisation: Technology enables companies to operate on a global scale, impacting profit to satisfy
market dynamics e.g E-commerce shareholders.
,AQA Year 13 MICROECONOMICS KNOWLEDGE ORGANISER Objectives of firms, profits & shut down points
Other business objectives Shut down points
Business survival: many businesses struggle to survive in a recession ie If a firm is making losses it may decide to shut down. In the
when market conditions change in a negative way; the goal of survival assumed it will still have to pay its fixed costs.
becomes more important. This may include finding ways to rationalise and The firm will shut down in the short run if:
cut costs or require innovative ways of boosting revenues; covering their Price per unit (AR) < average variable cost (AVC) or when t
variable costs in the short run may prevent the need to shut down. (TR) < total variable cost (TVC)
Quality: a firm may relax its short term profit-maximisation to improve the In the long run, all costs are variable, so the firm will shut d
quality of its product; this could be beneficial for longer term profit. long run if:
Environmental and social obligations (sometimes called as Corporate Social Price per unit (AR) < average total cost (ATC) or when tota
Responsibility CSR): some companies set targets to reduce carbon total cost (TC)
emissions and become carbon neutral and aim for more waste reduction.
Diagrams showing short run shut down poin
Other public interest objectives e.g not-for-profit organisations = firm that
operate commercially but aims to improve social welfare & environmental For a price taker For a price
goals; profits are reinvested for social purposes
Divorce of ownership from control
Divorce of ownership from control: separation between owners
(shareholders) who invest capital and managers who make day-to-day
decisions.
Conflict of objectives: Shareholders v managers
• Shareholders want high dividends and stock price appreciation, which
may be achieved through short-term profit maximization.
• Managers may prefer long-term goals like growth, market share, or In both cases, the firm is minimising its losses by producing
employee satisfaction, even if they sacrifice immediate profits. MC=MR. Losses are area ABCP. Point A is the shut down po
Consequences of this divorce: AR) If there was any increase in variable costs and/or decre
Short-termism: Pressure from shareholders can lead to decisions that then the firm would shut down.
neglect long-term investments in research and development or employee In the long run, there is no distinction between variable an
training, potentially hampering future growth. because all costs are variable; the diagrams would be the s
Agency problems: Managers may act in their own self-interest, such as the ATC curves drawn on AND the AVC curves would be labe
increasing executive compensation, even if it harms shareholders' profits.
,AQA Year 13 MICROECONOMICS KNOWLEDGE ORGANISER Efficiency
Economic efficiency X-inefficiency
Efficiency is about a society making optimal (best) use of our scarce X-inefficiency: when a firm is not operating at its optimal leve
resources to help satisfy changing wants and needs. due to internal factors such as poor management, lack of mot
Allocative efficiency bureaucratic inefficiencies.
Allocative efficiency: Allocative efficiency occurs when the value that Diagrams showing productive efficiency and X-ineff
consumers place on a product (reflected in the price they are willing and
Productive efficiency is a
able to pay) equals the marginal cost of factor resources used up in
output Q because the fir
production. The condition required for allocative efficiency in a market is
at its minimum LRAC (at
that price = marginal cost of supply (P = MC); on a diagram this is where AR
unit C1)
= MC
If the firm faced average
Allocative efficiency in a competitive market when its output was Q, i
Up to output Q, the price consumers are inefficient
willing to pay (shown by the demand
curve) is higher than the cost of the Dynamic efficiency
scarce resources used to produce the Dynamic efficiency: achieving efficiency over time; it refers to
good (shown by the supply curve), so it is innovation of products and production techniques and is all a
efficient to allocate scarce resources to term growth and development.
Product Innovation: when companies invest in R&D and introduce new
produce these units. For output units
services to increase their competitive advantage, reduce costs, and imp
beyond Q this is no longer the case. of their offerings.
Process innovation: the improvement of existing processes or the deve
In a competitive market, social welfare (consumer surplus + producer ones to increase efficiency and productivity e.g. automation
surplus) is maximised at when the equilibrium quantity is produced Creative destruction: Schumpeter's concept that states that innovation
technological change lead to the replacement of old technologies and p
Productive efficiency new ones, leading to economic growth and progress.
Productive efficiency: when a firm is producing goods or services at the Static v Dynamic efficiency
lowest possible average cost, using the fewest possible resources.
Static efficiency: the optimal allocation of resources at a specific point in
• Firm produces the maximum output with the given inputs, without any waste or
existing resources and processes, focused on efficiency and cost reductio
inefficiencies.
Dynamic efficiency: efficiency over time i.e. the long-term allocation of
Productive efficiency is achieved at an output that minimises the unit cost potential for continuous improvement and adapting to changing conditio
(AC) of production is on innovation, adaptability, and continuous improvement.
,AQA Year 13 MICROECONOMICS KNOWLEDGE ORGANISER Perfect competition
Characteristics of perfect competition Perfect competition in the long run
• Large number of buyers and sellers (firms)
• Homogenous (identical) products
• Perfect information
• No barriers to entry or exit
• Firms are price takers - they cannot influence the market price; demand
to the firm is perfectly elastic (horizontal) and P=AR=MR
• Supernormal profit is competed away in the long run
Perfect competition in the short run
In the long run, because there are no barriers to entry, new
the market to gain some of the supernormal profit. This cau
supply curve to shift right and the market price falls to P2.
has to take the new lower price P2: the profit-maximising o
Q2, where the firm is making normal profit only.
All supernormal profit is competed away by the entrance o
If the firm had been making losses in the short run, some firms
market & market supply shifts left; the market price would rise u
equilibrium is restored
In perfect competition, the firm 'takes' the market price P. Assuming
profit-maximisation, the firm will produce the output Q where MC=MR. Perfect competition & efficiency
At Q, AR is greater than AC, so profit per unit is AB. Total supernormal Allocative efficiency (P=MC): firms are allocatively efficient in bot
profit is the shaded area ABCP long run; as a price taker P=MR so when MC=MR, P=MC
Productive efficiency (min AC): in the long run, the firm will prod
Minimum losses in the short run AC curve is at its minimum, so firms are productively efficient
If the firm faced higher costs, so AC>AR at the output where MC=MR, then Dynamic efficiency; we assume firms make homogenous goods s
the firm is making losses. scope for innovation and differentiated to try to establish some m
• The firm will shut down if its revenue does not cover its variable costs (if However, it is worth noting that in the real world, firms in competi
AR< AVC) in the short run. often are very entrepreneurial and innovative, but these markets m
• The firm will stay open in the short run if AR>AVC meet the theoretical criteria for perfect competition
,AQA Year 13 MICROECONOMICS KNOWLEDGE ORGANISER
Monopoly
Characteristics of monopoly Monopoly in the long run
• Single seller In the long run, because there are high barriers to entry, no n
• Unique products (with no/few substitutes) join the market so the monopolist can earn the supernorma
• High barriers to entry long run.
• Firms are price makers - they can set the market price though are The diagram for the long run is the same as for the short run
constrained by demand – a higher price means a lower quantity If the firm had been making losses in the short run, it would have
demanded. Demand slopes downwards to the right D = AR , but MR is the long run unless demand increases (boosting revenue) or the fir
twice as steep because to sell more the firm has to reduce the price its costs.
• Supernormal profit can be earned in the long because barriers to entry Monopoly v monopoly power
are high In theory, there is one supplier in a monopoly, but a firm that
Monopoly in the short run 25% of a market can wield monopoly power
Assuming profit- Natural monopoly
maximisation, the firm Natural monopoly: a single firm can efficiently serve the enti
will produce the output to significant economies of scale e.g. utilities, transportation
Q where MC=MR. It can • High fixed costs relative to variable costs and declining a
charge price P according • High minimum efficient scale
to the demand curve. At Natural monopolies can benefit consumers by providing serv
Q, AR is greater than AC, costs than multiple competing firms would achieve, but they
so profit per unit is AB. regulation to prevent potential abuse of market power.
Total supernormal profit Monopoly and efficiency
is the shaded area ABCP
Allocative efficiency (P=MC): a monopoly is NOT allocatively
either the short nor long run; P>MC.
Productive efficiency (min LRAC): the monopoly is NOT prod
Minimum losses in the short run efficient – it produces to the left of the minimum AC
If the monopolist faced higher costs, so AC>AR at the output where MC=MR, Dynamic efficiency; the monopoly has supernormal profits it
then the firm is making losses. the business – it can use the profits for R&D and product and
• The firm will shut down if its revenue does not cover its variable costs (if innovation. The monopoly can therefore be dynamically effic
AR< AVC) in the short run. A monopoly that does not innovate may lose its market dom
• The firm will stay open in the short run if AR>AVC barriers to entry in the market may weaken
, AQA Year 13 MICROECONOMICS KNOWLEDGE ORGANISER Monopoly v Competition
Monopoly v competitive market Disadvantages of monopoly
Higher prices: Prices are higher in monopoly than under c
The monopoly produces where Loss of allocative efficiency (P > MC); net welfare loss com
MC=MR; its chooses output competition
Qm and charges price Pm. Inequality: may worsen because higher prices may affect t
If the market was competitive, incomes harder (regressive)
the equilibrium is where D = Sc X-inefficiencies: e.g. wasteful marketing spending because
at price Pc and quantity Qc. absence of market competition
To maximise its profits, the Diseconomies of scale: may cause a loss of productive effi
monopoly restricts output and long run
raises its price. Lack of choice for consumers: lower consumer welfare
Monopsony power: firms with market power can often us
pressure on their suppliers to reduce prices
This creates a net welfare loss of ABE because the monopoly is not
Supernormal profit: this may not be reinvested in the bus
allocatively efficient. The units of output between Qm and Qc are all
distributed to shareholders and/or used to increase CEO/m
valued more highly by consumers than the marginal cost of producing
them.
Advantages of monopoly
Monopoly costs v costs in competition Supernormal profit: can be used to fund extra capital inve
In the analysis above, there is a big underlying assumption that MCm = Sc research projects that spark innovation; dynamic efficiency
i.e. that the cost structure faced by the monopoly is the same as the Economies of scale: monopoly may have much lower costs
collective one for all the firms when the industry is competitive. industry was made up of smaller firms; this is especially th
This may not be the case if the monopoly can gain economies of scale. natural monopoly
If Sc lies to the left of MCm due to higher costs because of smaller scale Increase international competitiveness: a domestic mono
production by the competing firms, the monopoly price could be lower and economies of scale can compete more successfully on pric
its output higher than under perfect competition. international markets
For a natural monopoly, the most productively efficient scale is the largest; Regulation: laws and industry regulators can ensure mono
it makes sense to gain the economies of scale, but the monopoly may need exploit consumers with excessive prices and that they mai
regulation or be nationalised to prevent profiteering from high pricing Enables price discrimination: can help some lower-income
strategies Indeed, some services might be provided free to consume