Concise Notes on Hazards
Definitions:
- A hazard is a potential threat to human life and property caused by an
event, only becoming a hazard when it is a threat to people/lives
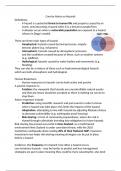
- A disaster occurs when a vulnerable population are exposed to a hazard
(shown in Degg’s model)
There are three main types of hazard:
- Geophysical: hazards caused by land processes, majorly
tectonic plates (e.g. volcanoes)
- Atmospheric: hazards caused by atmospheric processes
and the conditions created because of these, such as weather systems
(e.g. wildfires)
- Hydrological: hazards caused by water bodies and movements (e.g.
flooding)
They can also be a mixture of these such as hydrometeorological hazards
which are both atmospheric and hydrological.
Human Responses:
- Human responses to hazards can be both active and passive
A passive response is:
- Fatalism: the viewpoint that hazards are uncontrollable natural events
and that any losses should be accepted as there is nothing we can do to
stop them.
Active responses include:
- Prediction: using scientific research and past events in order to know
when a hazard may take place; this limits the impacts of the hazard.
- Adaptation: attempting to live with hazards by adjusting lifestyle choices
to decrease vulnerability (e.g. earthquake proof housing)
- Risk sharing: a form of community preparedness, where the risk is
shared through collectively investing into mitigation for future hazards
Risk sharing has proved successful in New Zealand: as a multi-hazard
environment New Zealand is under consistent threat, with the 2010
Canterbury earthquake alone costing 20% of their National GDP; insurance
investment now helps risk sharing meaning strategies can be put in place
before a hazard.
Incidence: the frequency of a hazard; how often a hazard occurs
Low incidence hazards – may be harder to predict and less management
strategies are put in place meaning they could be more catastrophic; also tend
, to be more intense than high incidence hazards (only 36 earthquakes since
1500 of a magnitude 8.5 or higher but millions each year)
The Park Model:
- A graphical representation of human responses to a hazard
- The steepness of the curve shows how quickly an area deteriorates or
recovers
- Depth of the curve shows scale of disaster (i.e. lower the curve, lower
quality of life)
Stage 1: relief (hours-days)
- Immediate local response such
as medical aid and search and
rescue
- Immediate appeal for foreign
aid – the beginnings of global
response
Stage 2: rehabilitation (days-weeks)
- Services begin to be restored
- Temporary hospitals and
shelters set up
- Food and water distributed
- Coordinated foreign aid (peacekeeping forces etc)
Stage 3: reconstruction (weeks-years)
- Restoring the area to the same or better quality of life
- Area returned to normal (ecosystem restored, crops regrown)
- Mitigation efforts for future events
This model also works on a control line allowing for easy comparison of
hazards or locations.
Positives: Negatives
- Control line allows for - Oversimplification, recovery
comparison between hazards paths can vary greatly
- Identifies key stages and - Doesn’t directly reference
provides a rough time-scale socio-economic disparities
- Features adjustable to - Doesn’t consider potential
represent impacts to quality of disruptions occurring after the
life recovery phase
Definitions:
- A hazard is a potential threat to human life and property caused by an
event, only becoming a hazard when it is a threat to people/lives
- A disaster occurs when a vulnerable population are exposed to a hazard
(shown in Degg’s model)
There are three main types of hazard:
- Geophysical: hazards caused by land processes, majorly
tectonic plates (e.g. volcanoes)
- Atmospheric: hazards caused by atmospheric processes
and the conditions created because of these, such as weather systems
(e.g. wildfires)
- Hydrological: hazards caused by water bodies and movements (e.g.
flooding)
They can also be a mixture of these such as hydrometeorological hazards
which are both atmospheric and hydrological.
Human Responses:
- Human responses to hazards can be both active and passive
A passive response is:
- Fatalism: the viewpoint that hazards are uncontrollable natural events
and that any losses should be accepted as there is nothing we can do to
stop them.
Active responses include:
- Prediction: using scientific research and past events in order to know
when a hazard may take place; this limits the impacts of the hazard.
- Adaptation: attempting to live with hazards by adjusting lifestyle choices
to decrease vulnerability (e.g. earthquake proof housing)
- Risk sharing: a form of community preparedness, where the risk is
shared through collectively investing into mitigation for future hazards
Risk sharing has proved successful in New Zealand: as a multi-hazard
environment New Zealand is under consistent threat, with the 2010
Canterbury earthquake alone costing 20% of their National GDP; insurance
investment now helps risk sharing meaning strategies can be put in place
before a hazard.
Incidence: the frequency of a hazard; how often a hazard occurs
Low incidence hazards – may be harder to predict and less management
strategies are put in place meaning they could be more catastrophic; also tend
, to be more intense than high incidence hazards (only 36 earthquakes since
1500 of a magnitude 8.5 or higher but millions each year)
The Park Model:
- A graphical representation of human responses to a hazard
- The steepness of the curve shows how quickly an area deteriorates or
recovers
- Depth of the curve shows scale of disaster (i.e. lower the curve, lower
quality of life)
Stage 1: relief (hours-days)
- Immediate local response such
as medical aid and search and
rescue
- Immediate appeal for foreign
aid – the beginnings of global
response
Stage 2: rehabilitation (days-weeks)
- Services begin to be restored
- Temporary hospitals and
shelters set up
- Food and water distributed
- Coordinated foreign aid (peacekeeping forces etc)
Stage 3: reconstruction (weeks-years)
- Restoring the area to the same or better quality of life
- Area returned to normal (ecosystem restored, crops regrown)
- Mitigation efforts for future events
This model also works on a control line allowing for easy comparison of
hazards or locations.
Positives: Negatives
- Control line allows for - Oversimplification, recovery
comparison between hazards paths can vary greatly
- Identifies key stages and - Doesn’t directly reference
provides a rough time-scale socio-economic disparities
- Features adjustable to - Doesn’t consider potential
represent impacts to quality of disruptions occurring after the
life recovery phase