Correlations
Correlation: a mathematical technique/ measure in which a researcher investigates an association, the strength and direction of
relationships between two or more variables being measured (co-variables)
A correlation is a method used to analyse data but it is not research methods, it can use methods such as self-report and
observations
Co-variables: variables instigated within the correlation e.g. height and weight. They are NOT referred to as IVs or DVs because a
correlation investigation the assocaiton between the variables, rather than trying to show a cause and effect relationship
Correlations are plotted on a scatter gram: one co-variable form the x-axis and the other the y-axis. Each point/ dot on the graph is
the x and y position of each co-variable
When conducting a study using a correlational analyse, you need to produce a correlational hypothesis that states the expected
relationship between co-variables NOT difference/ significant increase or decrease
Types of correlation:
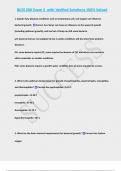
Positive correlation: as one co-variable increases, so does the other. The variables change in the same direction. E.g. the number of
people in a room and noise are positively correlated
Negative correlation: As one co-variable increases, the other decreases. The variables change in opposite directions. E.g. the number
of people in a room and the amount of personal space are negatively correlated
Zero correlation: When there is no relationship between co-variables. E.g. the number of people in the UK and the total daily rainfall
in Peru
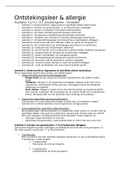
Linear correlation: a systematic relationship between co-variables that is defined by a straight line
Curvilinear correlation: A non-linear relationship between co-variables e.g. arousal and performance do not have a linear/ straight
relationship – performance on many tasks is depressed when arousal is too high/ too low, but is high when arousal is moderate.
Correlation co-efficient:
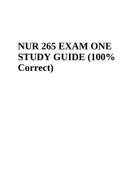
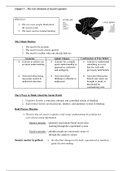
A number between -1 and +1 that tells us how closely the co-variables in a correlational analysis are related
Maximum value of 1.0 (+1.0 is a perfect positive correlation and -1.0 is a perfect negative correlation)
The + or – sign before e.g. .76 shows whether it is a positive or negative correlation
The co-efficient (number) tells us how closely the co-variables are related: -.76 is just a closely correlated as +.76
-.76 means that as one variable increases, the other decreases (negative correlation)
+.76 means that both variables increase together (positive correlation)
A statistical test is used to calculate the correlation coefficient
The difference between correlations and experiments:
In an experiment: the researcher controls/ manipulees an IV to measure the effect on the DV – as a result of this change in one
variable, it is possible to infer that the IV causes any observed changes to the DV
In a correlation, there no manipulation of one variable so it not possible to establish a cause and effect between one co-variable
and another (even if a strong positive correlation was found)
Other variables can affect/influence one of the co-variables (intervening variables)
STRENGTHS LIMITATIONS
Correlations are a useful preliminary tool for research: by Due to a lack of manipulation and control, correlational studies can
assessing the strength & direction of a relations, they provide a only tell us how variables are related but not why. Correlations
precise & quantifiable measure of how two-variables are cannot demonstrate cause and effect between variables and
related. This may suggest ideas for possible future research if therefore we do not know which co-variable is causing the other to
variables are strongly related/ demonstrate an interesting change. Establishing the direction of the effect is an issue.
pattern
Correlations are often used as a starting point to assess possible It is possible that another untested variable is causing the
patterns between variables before researchers commit to an relationship between the two co-variables – an intervening variable.
experimental study A third variable problem. Therefore, people often misinterpret
They are relatively quick and economical to carry out correlations and assume a caudal relationship has been
demonstrated – leads to public misunderstandings
There is no need for a controlled environment and no As with experiments, studies using correlational analysis may lack
manipulation of variables is required internal/ external validity – sample may lack generalisability
Data collection by others (secondary data such as government Correlations show linear relationships but may not reflect
statistics) can be used, which correlations are less time- curvilinear ones
consuming than experiments
Correlations are used when is practically/ ethically impossible to
manipulate variables (they are only measured). By avoiding
manipulation, they are more true to life and ethical than doing
experiments
, Content analysis
A kind of observational study in which behaviour is observed indirectly in written and verbal material
A detailed analysis is made of, for example, books, diaries, or TV programmes
May involve either qualitative or quantitative analysis
The aim is to summarise and describe forms of communication in a systematic way so overall conclusions
can be drawn
1. Sample/ sampling method: what material to sample and how frequently e.g. time sampling
(recording behaviour that happens in a timeframe) or event sampling (code an event every time to
happens). Other considerations include deciding which TV channels/ books to include, how many
programmes, what length of time. Does the researcher look at every 5th page, select books
randomly form a library or analyse ads on the TV every 30 seconds and note when certain
behaviours occur?
2. Method of recording data: coding the data e.g. using behavioural categories (dividing a target
behaviour such as stress or aggression, into a subset of behaviours) or a coding frame (a systematic
method for recording observations in which an individual’s behaviours are given a code for ease of
recording)
3. Method of representing / coding the data: coding is the process of placing quantitative or
qualitative data into categories and is the initial stage to identify coding units to analyse the data.
First you either use time/ event sampling and then record data either by counting instances of each
coding unit (quantitative analysis) or by describing examples in each category (qualitative analysis)
STRENGTHS LIMITATIONS
Tends to have high ecological validity because it is Observer bias reduced the objectivity and validity of
based on observations of what people actually do findings because different observers may interpret
– real communications that are current and the meaning of the behavioural categories differently.
relevant, such as newspapers or books It is important to ensure that if there are multiple
researchers, they apply criteria in the same way by
calculating inter-observer reliability (inter-rater
reliability)
When sources can be retained/ accessed by Likely to be culture biased because interpretation of
others, the content analysis can be replicated and verbal/ written content will be affected by the
therefore observations can be tested for reliability language and culture of the observer and behavioural
categories used
People tend to be studied indirectly outside of the
context which information was collated: danger that
the researcher may attribute opinions & motivations
to the speaker/ writer that were not intended
originally
Compare to the thematic analysis
Correlation: a mathematical technique/ measure in which a researcher investigates an association, the strength and direction of
relationships between two or more variables being measured (co-variables)
A correlation is a method used to analyse data but it is not research methods, it can use methods such as self-report and
observations
Co-variables: variables instigated within the correlation e.g. height and weight. They are NOT referred to as IVs or DVs because a
correlation investigation the assocaiton between the variables, rather than trying to show a cause and effect relationship
Correlations are plotted on a scatter gram: one co-variable form the x-axis and the other the y-axis. Each point/ dot on the graph is
the x and y position of each co-variable
When conducting a study using a correlational analyse, you need to produce a correlational hypothesis that states the expected
relationship between co-variables NOT difference/ significant increase or decrease
Types of correlation:
Positive correlation: as one co-variable increases, so does the other. The variables change in the same direction. E.g. the number of
people in a room and noise are positively correlated
Negative correlation: As one co-variable increases, the other decreases. The variables change in opposite directions. E.g. the number
of people in a room and the amount of personal space are negatively correlated
Zero correlation: When there is no relationship between co-variables. E.g. the number of people in the UK and the total daily rainfall
in Peru
Linear correlation: a systematic relationship between co-variables that is defined by a straight line
Curvilinear correlation: A non-linear relationship between co-variables e.g. arousal and performance do not have a linear/ straight
relationship – performance on many tasks is depressed when arousal is too high/ too low, but is high when arousal is moderate.
Correlation co-efficient:
A number between -1 and +1 that tells us how closely the co-variables in a correlational analysis are related
Maximum value of 1.0 (+1.0 is a perfect positive correlation and -1.0 is a perfect negative correlation)
The + or – sign before e.g. .76 shows whether it is a positive or negative correlation
The co-efficient (number) tells us how closely the co-variables are related: -.76 is just a closely correlated as +.76
-.76 means that as one variable increases, the other decreases (negative correlation)
+.76 means that both variables increase together (positive correlation)
A statistical test is used to calculate the correlation coefficient
The difference between correlations and experiments:
In an experiment: the researcher controls/ manipulees an IV to measure the effect on the DV – as a result of this change in one
variable, it is possible to infer that the IV causes any observed changes to the DV
In a correlation, there no manipulation of one variable so it not possible to establish a cause and effect between one co-variable
and another (even if a strong positive correlation was found)
Other variables can affect/influence one of the co-variables (intervening variables)
STRENGTHS LIMITATIONS
Correlations are a useful preliminary tool for research: by Due to a lack of manipulation and control, correlational studies can
assessing the strength & direction of a relations, they provide a only tell us how variables are related but not why. Correlations
precise & quantifiable measure of how two-variables are cannot demonstrate cause and effect between variables and
related. This may suggest ideas for possible future research if therefore we do not know which co-variable is causing the other to
variables are strongly related/ demonstrate an interesting change. Establishing the direction of the effect is an issue.
pattern
Correlations are often used as a starting point to assess possible It is possible that another untested variable is causing the
patterns between variables before researchers commit to an relationship between the two co-variables – an intervening variable.
experimental study A third variable problem. Therefore, people often misinterpret
They are relatively quick and economical to carry out correlations and assume a caudal relationship has been
demonstrated – leads to public misunderstandings
There is no need for a controlled environment and no As with experiments, studies using correlational analysis may lack
manipulation of variables is required internal/ external validity – sample may lack generalisability
Data collection by others (secondary data such as government Correlations show linear relationships but may not reflect
statistics) can be used, which correlations are less time- curvilinear ones
consuming than experiments
Correlations are used when is practically/ ethically impossible to
manipulate variables (they are only measured). By avoiding
manipulation, they are more true to life and ethical than doing
experiments
, Content analysis
A kind of observational study in which behaviour is observed indirectly in written and verbal material
A detailed analysis is made of, for example, books, diaries, or TV programmes
May involve either qualitative or quantitative analysis
The aim is to summarise and describe forms of communication in a systematic way so overall conclusions
can be drawn
1. Sample/ sampling method: what material to sample and how frequently e.g. time sampling
(recording behaviour that happens in a timeframe) or event sampling (code an event every time to
happens). Other considerations include deciding which TV channels/ books to include, how many
programmes, what length of time. Does the researcher look at every 5th page, select books
randomly form a library or analyse ads on the TV every 30 seconds and note when certain
behaviours occur?
2. Method of recording data: coding the data e.g. using behavioural categories (dividing a target
behaviour such as stress or aggression, into a subset of behaviours) or a coding frame (a systematic
method for recording observations in which an individual’s behaviours are given a code for ease of
recording)
3. Method of representing / coding the data: coding is the process of placing quantitative or
qualitative data into categories and is the initial stage to identify coding units to analyse the data.
First you either use time/ event sampling and then record data either by counting instances of each
coding unit (quantitative analysis) or by describing examples in each category (qualitative analysis)
STRENGTHS LIMITATIONS
Tends to have high ecological validity because it is Observer bias reduced the objectivity and validity of
based on observations of what people actually do findings because different observers may interpret
– real communications that are current and the meaning of the behavioural categories differently.
relevant, such as newspapers or books It is important to ensure that if there are multiple
researchers, they apply criteria in the same way by
calculating inter-observer reliability (inter-rater
reliability)
When sources can be retained/ accessed by Likely to be culture biased because interpretation of
others, the content analysis can be replicated and verbal/ written content will be affected by the
therefore observations can be tested for reliability language and culture of the observer and behavioural
categories used
People tend to be studied indirectly outside of the
context which information was collated: danger that
the researcher may attribute opinions & motivations
to the speaker/ writer that were not intended
originally
Compare to the thematic analysis