

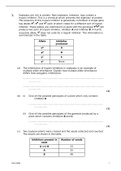
1. Soybeans are rich in protein. Raw soybeans, however, may contain a
trypsin inhibitor. This is a chemical which prevents the digestion of protein.
The presence of this trypsin inhibitor is genetically controlled. A single gene
A B C
has alleles T , T and T each of which codes for a different sort of trypsin
A B
inhibitor. These alleles are codominant so plant with the genotype T T will
produce two sorts of trypsin inhibitor, inhibitor A and inhibitor B. A fourth,
o
recessive allele, T does not code for a trypsin inhibitor. This information is
summarised in the table.
Allele Inhibitor
produced
T
A A
B B
T
T
C C
o None
T
(a) The inheritance of trypsin inhibitors in soybeans is an example of
multiple allele inheritance. Explain how multiple allele inheritance
differs from polygenic inheritance.
..................................................................................................................
.................
..................................................................................................................
.................
(1)
(b) (i) Give all the possible genotypes of a plant which only contains
inhibitor A.
.........................................................................................................
..................
(1)
(ii) Give all the possible genotypes of the gametes produced by a
plant which contains inhibitors B and C.
.........................................................................................................
..................
(1)
(c) Two soybean plants were crossed and the seeds collected and counted.
The results are shown in the table.
Inhibitors present in Number of seeds
seed
A and B 23
A 25
B 48
Anis Uddin 1
, (i) Complete the genetic diagram to explain the results of this cross.
Phenotypes of parents:..................................
.......................................
Genotypes of parents:..................................
.......................................
Genotypes of
gametes ...........................................................................
...........
Genotypes of
offspring: .................................................................................
...
Phenotypes of offspringInhibitor A Inhibitor A Inhibitor B
and
Inhibitor B
(3)
(ii) A chi-squared test was applied to the data collected in this
investigation. Explain why statistical tests such as the Chi-squared
test should be carried out on data like these.
.........................................................................................................
..................
.........................................................................................................
..................
.........................................................................................................
..................
(2)
Anis Uddin 2
, An investigation was carried out on the insects living on bean crops. The
graph shows the relationship between the biomass of primary consumers,
secondary consumers and producers.
100
90 P rim a ry
co n su m e rs
80
70
C onsum er 60
–2
b io m a s s /g m
50
40
30
20
10 S e c o n d a ry
c o n su m e rs
0
0 200 400 600 800 1000
–2
P ro d u c e r s b io m a s s /g m
(d) Briefly describe how the data on the biomass of the producers might
have been collected.
..................................................................................................................
.................
..................................................................................................................
.................
..................................................................................................................
.................
..................................................................................................................
.................
(2)
Anis Uddin 3
, (e) (i) In this investigation, the efficiency with which the energy in
sunlight was converted into energy in the biomass of the
producers was found to be 4%. For every 10 000 kJ of light energy
falling on the beans, 400 kJ was therefore converted into energy in
producer biomass. Use the data in the graph to complete the
diagram below which shows the amount of biomass in the primary
consumers and the secondary consumers.
Energy in sunlight 10 000 kJ
4%
Energy in producer biomass 400 kJ
......... %
Energy in primary consumer biomass. ...... kJ
......... %
Energy in secondary consumer biomass. ...... kJ
(2)
(ii) Explain why not all of the energy in producer biomass can be
converted into energy in primary consumer biomass.
.........................................................................................................
..................
.........................................................................................................
..................
.........................................................................................................
..................
(2)
(Total 14 marks)
2. Hares are small mammals similar to rabbits. The diagram shows how some
of the hares found in southern Africa are classified.
Anis Uddin 4
trypsin inhibitor. This is a chemical which prevents the digestion of protein.
The presence of this trypsin inhibitor is genetically controlled. A single gene
A B C
has alleles T , T and T each of which codes for a different sort of trypsin
A B
inhibitor. These alleles are codominant so plant with the genotype T T will
produce two sorts of trypsin inhibitor, inhibitor A and inhibitor B. A fourth,
o
recessive allele, T does not code for a trypsin inhibitor. This information is
summarised in the table.
Allele Inhibitor
produced
T
A A
B B
T
T
C C
o None
T
(a) The inheritance of trypsin inhibitors in soybeans is an example of
multiple allele inheritance. Explain how multiple allele inheritance
differs from polygenic inheritance.
..................................................................................................................
.................
..................................................................................................................
.................
(1)
(b) (i) Give all the possible genotypes of a plant which only contains
inhibitor A.
.........................................................................................................
..................
(1)
(ii) Give all the possible genotypes of the gametes produced by a
plant which contains inhibitors B and C.
.........................................................................................................
..................
(1)
(c) Two soybean plants were crossed and the seeds collected and counted.
The results are shown in the table.
Inhibitors present in Number of seeds
seed
A and B 23
A 25
B 48
Anis Uddin 1
, (i) Complete the genetic diagram to explain the results of this cross.
Phenotypes of parents:..................................
.......................................
Genotypes of parents:..................................
.......................................
Genotypes of
gametes ...........................................................................
...........
Genotypes of
offspring: .................................................................................
...
Phenotypes of offspringInhibitor A Inhibitor A Inhibitor B
and
Inhibitor B
(3)
(ii) A chi-squared test was applied to the data collected in this
investigation. Explain why statistical tests such as the Chi-squared
test should be carried out on data like these.
.........................................................................................................
..................
.........................................................................................................
..................
.........................................................................................................
..................
(2)
Anis Uddin 2
, An investigation was carried out on the insects living on bean crops. The
graph shows the relationship between the biomass of primary consumers,
secondary consumers and producers.
100
90 P rim a ry
co n su m e rs
80
70
C onsum er 60
–2
b io m a s s /g m
50
40
30
20
10 S e c o n d a ry
c o n su m e rs
0
0 200 400 600 800 1000
–2
P ro d u c e r s b io m a s s /g m
(d) Briefly describe how the data on the biomass of the producers might
have been collected.
..................................................................................................................
.................
..................................................................................................................
.................
..................................................................................................................
.................
..................................................................................................................
.................
(2)
Anis Uddin 3
, (e) (i) In this investigation, the efficiency with which the energy in
sunlight was converted into energy in the biomass of the
producers was found to be 4%. For every 10 000 kJ of light energy
falling on the beans, 400 kJ was therefore converted into energy in
producer biomass. Use the data in the graph to complete the
diagram below which shows the amount of biomass in the primary
consumers and the secondary consumers.
Energy in sunlight 10 000 kJ
4%
Energy in producer biomass 400 kJ
......... %
Energy in primary consumer biomass. ...... kJ
......... %
Energy in secondary consumer biomass. ...... kJ
(2)
(ii) Explain why not all of the energy in producer biomass can be
converted into energy in primary consumer biomass.
.........................................................................................................
..................
.........................................................................................................
..................
.........................................................................................................
..................
(2)
(Total 14 marks)
2. Hares are small mammals similar to rabbits. The diagram shows how some
of the hares found in southern Africa are classified.
Anis Uddin 4


