Solution and Answer Guide: Ellingson and Panorska, Probability and Statistics for Engineering and the Sciences,
10e, 2027, 9798214023823; Chapter 1: Overview and Descriptive Statistics
Solution and Answer Guide
ELLINGSON AND PANORSKA, PROBABILITY AND STATISTICS FOR ENGINEERING AND THE SCIENCES,
10E, 2027, 9798214023823; CHAPTER 1: OVERVIEW AND DESCRIPTIVE STATISTICS
TABLE OF CONTENTS
Section 1.1 .............................................................................................................................1
Section 1.2 ........................................................................................................................... 3
Section 1.3 ......................................................................................................................... 18
Section 1.4 ......................................................................................................................... 24
SECTION 1.1
1.
Solutions:
a. Los Angeles Times, Chicago Tribune, Gainesville Sun, Washington Post
b. France, Sweden, Denmark, Malta
c. Alice Johnson, Catherine Miller, Emma Davis, Ken Lee
d. 2.97, 3.56, 2.20, 2.97
2.
Solutions:
a. 45.3 m, 52.7 m, 60.1 m, 48.9 m
b. 432 pp, 196 pp, 184 pp, 321 pp
c. 4.5, 4.9, 5.6, 6.4
d. 0.07 g, 1.58 g, 7.1 g, 27.2 g
3.
Solutions:
a. How likely is it that more than half of the sampled computers will need or have
needed warranty service? What is the expected number among the 100 that need
warranty service? How likely is it that the number needing warranty service will
exceed the expected number by more than 10?
b. Suppose that 15 of the 100 sampled needed warranty service. How confident can
we be that the proportion of all such computers needing warranty service is
between .08 and .22? Does the sample provide compelling evidence for concluding
that more than 10% of all such computers need warranty service?
© 2027 1
, Solution and Answer Guide: Ellingson and Panorska, Probability and Statistics for Engineering and the Sciences,
10e, 2027, 9798214023823; Chapter 1: Overview and Descriptive Statistics
4.
Solutions:
a. Concrete populations: all living citizens of U.S., all the mutual funds currently
marketed in U.S., all the books that were published in 1980. Hypothetical
populations: All GPAs of the University of California undergraduates in the next
academic year, page lengths of all books that will be published next year, the
batting averages of all major league players in the next baseball season.
b. (Concrete) Probability: In a sample of 5 mutual funds, what is the chance that all
5 have rates of return which exceeded 10% last year? Statistics: If previous year
rates-of-return for 5 mutual funds were 9.6, 14.5, 8.3, 9.9 and 10.2, can we
conclude that the average rate for all funds was below 10%? (Hypothetical)
Probability: In a sample of 10 books to be published next year, how likely is it that
the average number of pages for the 10 is between 200 and 250? Statistics: If the
sample average number of pages for 10 books is 227, can we be highly confident
that the average for all books is between 200 and 245?
5.
Solutions:
a. No. All students taking a large statistics course who participate in an SI program of
this sort.
b. The advantage to randomly allocating students to the two groups is that the two
groups should then be fairly comparable before the study. If the two groups
perform differently in the class, we might attribute this to the treatments (SI and
control). If students were allowed to choose, stronger or more motivated students
might prefer SI, which could bias the results.
c. If all students were put in the treatment group, there would be no firm basis for
assessing the effectiveness of SI (nothing to which the SI scores could reasonably
be compared).
6.
Solution:
One could take a simple random sample of students from all students in the California
State University system and ask each student in the sample to report the distance
from their hometown to campus. Alternatively, the sample could be generated by
taking a stratified random sample by taking a simple random sample from each of the
23 campuses and again asking each student in the sample to report the distance from
their hometown to campus. Certain problems might arise with self-reporting of
distances, such as recording error or poor recall. This study is enumerative because
there exists a finite, identifiable population of objects from which to sample.
7.
Solution:
One could generate a simple random sample of all single-family homes in the city, or a
stratified random sample by taking a simple random sample from each of the 10 district
neighborhoods. From each of the selected homes, values of all desired variables would be
© 2027 2
, Solution and Answer Guide: Ellingson and Panorska, Probability and Statistics for Engineering and the Sciences,
10e, 2027, 9798214023823; Chapter 1: Overview and Descriptive Statistics
determined. This is an enumerative study as there is a finite, well-defined population of
objects that can be used as a sample.
8.
Solutions:
a. Number observations equal 2 2 2 = 8
b. This could be called an analytic study because the data would be collected on an
existing process. There is no sampling frame.
9.
Solutions:
a. The measurements might vary for different reasons. Some of these include
measurement error resulting from mechanical or technical changes across
measurements, recording errors, differences in weather conditions at the time of
measurements, etc.
b. No, because there is no sampling frame.
SECTION 1.2
10.
Solutions:
a.
5 9
6 33588
7 00234677889
8 127
9 077 stem: ones
10 7 leaf: tenths
11 368
A representative strength for these beams is around 7.8 MPa, but there is a
reasonably large amount of variation around that representative value.
(What constitutes large or small variation usually depends on context, but variation
is usually considered large when the range of the data – the difference between
the largest and smallest value – is comparable to a representative value. Here, the
range is 11.8 − 5.9 = 5.9 MPa, which is similar in size to the representative value of
7.8 MPa. So, most researchers would call this a large amount of variation.)
b. The data display is not perfectly symmetric around some middle/representative
value. There is some positive skewness in this data.
c. Outliers are data points that appear to be very different from the pack. Looking at
the stem-and-leaf display in part (a), there appear to be no outliers in this data.
(A later section gives a more precise definition of what constitutes an outlier.)
d. From the stem-and-leaf display in part (a), there are 4 values greater than 10.
Therefore, the proportion of data values that exceed 10 is 4/27 = .148, or, about 15%.
© 2027 3
, Solution and Answer Guide: Ellingson and Panorska, Probability and Statistics for Engineering and the Sciences,
10e, 2027, 9798214023823; Chapter 1: Overview and Descriptive Statistics
11.
Solution:
3L 1
3H 56678
4L 000112222234
4H 5667888 stem: tenths
5L 144 leaf: hundredths
5H 58
6L 2
6H 6678
7L
7H 5
The stem-and-leaf plot shows that .45 is a good representative value for the data. It
also shows that the plot is not symmetric and it is positively skewed. The range of the
data is .75 − .31 = .44, which is comparable to the typical value of .45. This constitutes
a reasonably large amount of variation in the data. The data value .75 is a possible
outlier.
12.
Solutions:
The sample size for this data set is n = 5 + 15 + 27 + 34 + 22 + 14 + 7 + 2 + 4 + 1 = 131 .
a. The first four intervals correspond to observations less than 5, so the proportion of
( )
values less than 5 is 5 + 15 + 27 + 34 /131 = 81/131 = .618.
b. The last four intervals correspond to observations at least 6, so the proportion of
( )
values at least 6 is 7 + 2 + 4 + 1 /131 = 14/131 = .107.
c. The relative frequency and density histograms are shown below. The distribution of
CeO2 particle sizes is not symmetric, but are positively skewed. Notice that the
relative frequency and density histograms are essentially identical, other than the
vertical axis labeling, because the bin widths are all the same.
© 2027 4
10e, 2027, 9798214023823; Chapter 1: Overview and Descriptive Statistics
Solution and Answer Guide
ELLINGSON AND PANORSKA, PROBABILITY AND STATISTICS FOR ENGINEERING AND THE SCIENCES,
10E, 2027, 9798214023823; CHAPTER 1: OVERVIEW AND DESCRIPTIVE STATISTICS
TABLE OF CONTENTS
Section 1.1 .............................................................................................................................1
Section 1.2 ........................................................................................................................... 3
Section 1.3 ......................................................................................................................... 18
Section 1.4 ......................................................................................................................... 24
SECTION 1.1
1.
Solutions:
a. Los Angeles Times, Chicago Tribune, Gainesville Sun, Washington Post
b. France, Sweden, Denmark, Malta
c. Alice Johnson, Catherine Miller, Emma Davis, Ken Lee
d. 2.97, 3.56, 2.20, 2.97
2.
Solutions:
a. 45.3 m, 52.7 m, 60.1 m, 48.9 m
b. 432 pp, 196 pp, 184 pp, 321 pp
c. 4.5, 4.9, 5.6, 6.4
d. 0.07 g, 1.58 g, 7.1 g, 27.2 g
3.
Solutions:
a. How likely is it that more than half of the sampled computers will need or have
needed warranty service? What is the expected number among the 100 that need
warranty service? How likely is it that the number needing warranty service will
exceed the expected number by more than 10?
b. Suppose that 15 of the 100 sampled needed warranty service. How confident can
we be that the proportion of all such computers needing warranty service is
between .08 and .22? Does the sample provide compelling evidence for concluding
that more than 10% of all such computers need warranty service?
© 2027 1
, Solution and Answer Guide: Ellingson and Panorska, Probability and Statistics for Engineering and the Sciences,
10e, 2027, 9798214023823; Chapter 1: Overview and Descriptive Statistics
4.
Solutions:
a. Concrete populations: all living citizens of U.S., all the mutual funds currently
marketed in U.S., all the books that were published in 1980. Hypothetical
populations: All GPAs of the University of California undergraduates in the next
academic year, page lengths of all books that will be published next year, the
batting averages of all major league players in the next baseball season.
b. (Concrete) Probability: In a sample of 5 mutual funds, what is the chance that all
5 have rates of return which exceeded 10% last year? Statistics: If previous year
rates-of-return for 5 mutual funds were 9.6, 14.5, 8.3, 9.9 and 10.2, can we
conclude that the average rate for all funds was below 10%? (Hypothetical)
Probability: In a sample of 10 books to be published next year, how likely is it that
the average number of pages for the 10 is between 200 and 250? Statistics: If the
sample average number of pages for 10 books is 227, can we be highly confident
that the average for all books is between 200 and 245?
5.
Solutions:
a. No. All students taking a large statistics course who participate in an SI program of
this sort.
b. The advantage to randomly allocating students to the two groups is that the two
groups should then be fairly comparable before the study. If the two groups
perform differently in the class, we might attribute this to the treatments (SI and
control). If students were allowed to choose, stronger or more motivated students
might prefer SI, which could bias the results.
c. If all students were put in the treatment group, there would be no firm basis for
assessing the effectiveness of SI (nothing to which the SI scores could reasonably
be compared).
6.
Solution:
One could take a simple random sample of students from all students in the California
State University system and ask each student in the sample to report the distance
from their hometown to campus. Alternatively, the sample could be generated by
taking a stratified random sample by taking a simple random sample from each of the
23 campuses and again asking each student in the sample to report the distance from
their hometown to campus. Certain problems might arise with self-reporting of
distances, such as recording error or poor recall. This study is enumerative because
there exists a finite, identifiable population of objects from which to sample.
7.
Solution:
One could generate a simple random sample of all single-family homes in the city, or a
stratified random sample by taking a simple random sample from each of the 10 district
neighborhoods. From each of the selected homes, values of all desired variables would be
© 2027 2
, Solution and Answer Guide: Ellingson and Panorska, Probability and Statistics for Engineering and the Sciences,
10e, 2027, 9798214023823; Chapter 1: Overview and Descriptive Statistics
determined. This is an enumerative study as there is a finite, well-defined population of
objects that can be used as a sample.
8.
Solutions:
a. Number observations equal 2 2 2 = 8
b. This could be called an analytic study because the data would be collected on an
existing process. There is no sampling frame.
9.
Solutions:
a. The measurements might vary for different reasons. Some of these include
measurement error resulting from mechanical or technical changes across
measurements, recording errors, differences in weather conditions at the time of
measurements, etc.
b. No, because there is no sampling frame.
SECTION 1.2
10.
Solutions:
a.
5 9
6 33588
7 00234677889
8 127
9 077 stem: ones
10 7 leaf: tenths
11 368
A representative strength for these beams is around 7.8 MPa, but there is a
reasonably large amount of variation around that representative value.
(What constitutes large or small variation usually depends on context, but variation
is usually considered large when the range of the data – the difference between
the largest and smallest value – is comparable to a representative value. Here, the
range is 11.8 − 5.9 = 5.9 MPa, which is similar in size to the representative value of
7.8 MPa. So, most researchers would call this a large amount of variation.)
b. The data display is not perfectly symmetric around some middle/representative
value. There is some positive skewness in this data.
c. Outliers are data points that appear to be very different from the pack. Looking at
the stem-and-leaf display in part (a), there appear to be no outliers in this data.
(A later section gives a more precise definition of what constitutes an outlier.)
d. From the stem-and-leaf display in part (a), there are 4 values greater than 10.
Therefore, the proportion of data values that exceed 10 is 4/27 = .148, or, about 15%.
© 2027 3
, Solution and Answer Guide: Ellingson and Panorska, Probability and Statistics for Engineering and the Sciences,
10e, 2027, 9798214023823; Chapter 1: Overview and Descriptive Statistics
11.
Solution:
3L 1
3H 56678
4L 000112222234
4H 5667888 stem: tenths
5L 144 leaf: hundredths
5H 58
6L 2
6H 6678
7L
7H 5
The stem-and-leaf plot shows that .45 is a good representative value for the data. It
also shows that the plot is not symmetric and it is positively skewed. The range of the
data is .75 − .31 = .44, which is comparable to the typical value of .45. This constitutes
a reasonably large amount of variation in the data. The data value .75 is a possible
outlier.
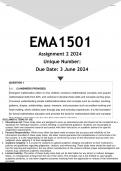
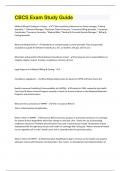
12.
Solutions:
The sample size for this data set is n = 5 + 15 + 27 + 34 + 22 + 14 + 7 + 2 + 4 + 1 = 131 .
a. The first four intervals correspond to observations less than 5, so the proportion of
( )
values less than 5 is 5 + 15 + 27 + 34 /131 = 81/131 = .618.
b. The last four intervals correspond to observations at least 6, so the proportion of
( )
values at least 6 is 7 + 2 + 4 + 1 /131 = 14/131 = .107.
c. The relative frequency and density histograms are shown below. The distribution of
CeO2 particle sizes is not symmetric, but are positively skewed. Notice that the
relative frequency and density histograms are essentially identical, other than the
vertical axis labeling, because the bin widths are all the same.
© 2027 4