ECON2061 Econometrics │ Comprehensive Study Notes
ECON2061
ECONOMETRICS
━━━━━━━━━━━━━━━━━━━━━━━━━━━━
Complete Study Notes with Worked Examples & Diagrams
Durham University │ Department of Economics
Based on Stock & Watson: Introduction to Econometrics
Topics Covered:
Linear Regression │ Hypothesis Testing │ OVB │ Nonlinear Models
Binary Outcomes │ Panel Data │ Instrumental Variables │ Time Series
📚 NOTE: Always check your current module guide for specific assessment details, as content and
format may vary by year.
Page 1
, ECON2061 Econometrics │ Comprehensive Study Notes
Contents
PART A: FOUNDATIONS
1. The Linear Regression Model
2. OLS Estimation
3. Measures of Fit (R², Adjusted R², SER)
4. The Least Squares Assumptions
5. Hypothesis Testing
6. Confidence Intervals
PART B: THREATS TO INTERNAL VALIDITY
7. Omitted Variable Bias (OVB)
8. Other Threats to Validity
PART C: EXTENSIONS
9. Nonlinear Regression Functions
10. Binary Dependent Variables
PART D: ADVANCED TOPICS
11. Panel Data & Fixed Effects
12. Instrumental Variables
13. Time Series Analysis
PART E: PRACTICE
14. Worked Exam Questions
15. Formula Sheet & Quick Reference
16. Statistical Tables
Page 2
, ECON2061 Econometrics │ Comprehensive Study Notes
PART A: Foundations of Regression
1. The Linear Regression Model
1.1 What is Econometrics?
Econometrics is the application of statistical methods to economic data to give empirical content to
economic relationships. The central goal is often to estimate causal effects — how much does Y change
when X changes, holding all else constant?
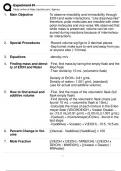
1.2 The Population Regression Function
The population regression function (PRF) describes how the conditional mean of Y relates to X:
E(Y│X) = β₀ + β₁X
This says: the average value of Y, for observations with a particular value of X, is a linear function of X.
1.3 The Linear Regression Model
The full regression model includes an error term to account for deviations from the population mean:
Yᵢ = β₀ + β₁Xᵢ + uᵢ
Key Components:
Symbol Meaning
Yᵢ Dependent variable (outcome) for observation i
Xᵢ Independent variable (regressor, explanatory variable) for observation i
β₀ Intercept — the value of E(Y) when X = 0
β₁ Slope — the change in E(Y) for a one-unit change in X. This is the causal effect we
want to estimate.
uᵢ Error term — captures everything that affects Y besides X (omitted variables,
measurement error, inherent randomness)
Figure 1.1: The Regression Line
Page 3
ECON2061
ECONOMETRICS
━━━━━━━━━━━━━━━━━━━━━━━━━━━━
Complete Study Notes with Worked Examples & Diagrams
Durham University │ Department of Economics
Based on Stock & Watson: Introduction to Econometrics
Topics Covered:
Linear Regression │ Hypothesis Testing │ OVB │ Nonlinear Models
Binary Outcomes │ Panel Data │ Instrumental Variables │ Time Series
📚 NOTE: Always check your current module guide for specific assessment details, as content and
format may vary by year.
Page 1
, ECON2061 Econometrics │ Comprehensive Study Notes
Contents
PART A: FOUNDATIONS
1. The Linear Regression Model
2. OLS Estimation
3. Measures of Fit (R², Adjusted R², SER)
4. The Least Squares Assumptions
5. Hypothesis Testing
6. Confidence Intervals
PART B: THREATS TO INTERNAL VALIDITY
7. Omitted Variable Bias (OVB)
8. Other Threats to Validity
PART C: EXTENSIONS
9. Nonlinear Regression Functions
10. Binary Dependent Variables
PART D: ADVANCED TOPICS
11. Panel Data & Fixed Effects
12. Instrumental Variables
13. Time Series Analysis
PART E: PRACTICE
14. Worked Exam Questions
15. Formula Sheet & Quick Reference
16. Statistical Tables
Page 2
, ECON2061 Econometrics │ Comprehensive Study Notes
PART A: Foundations of Regression
1. The Linear Regression Model
1.1 What is Econometrics?
Econometrics is the application of statistical methods to economic data to give empirical content to
economic relationships. The central goal is often to estimate causal effects — how much does Y change
when X changes, holding all else constant?
1.2 The Population Regression Function
The population regression function (PRF) describes how the conditional mean of Y relates to X:
E(Y│X) = β₀ + β₁X
This says: the average value of Y, for observations with a particular value of X, is a linear function of X.
1.3 The Linear Regression Model
The full regression model includes an error term to account for deviations from the population mean:
Yᵢ = β₀ + β₁Xᵢ + uᵢ
Key Components:
Symbol Meaning
Yᵢ Dependent variable (outcome) for observation i
Xᵢ Independent variable (regressor, explanatory variable) for observation i
β₀ Intercept — the value of E(Y) when X = 0
β₁ Slope — the change in E(Y) for a one-unit change in X. This is the causal effect we
want to estimate.
uᵢ Error term — captures everything that affects Y besides X (omitted variables,
measurement error, inherent randomness)
Figure 1.1: The Regression Line
Page 3