Lecture 4 Measure phase
Measure phase
- Objectives
- Data collection
- Variation
- Six Sigma & process capability
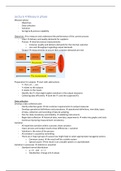
Objectives to measure and understand the performance of the current process
- Input delivery and quality demands for suppliers
- Process internal process measurements
o Inclusive: quality and delivery demands for the internal customer
o Loss and throughput regarding output demands
- Output measurements to assure that customer demands are met
Preparation for analysis start with abstractions
- Y = f(x1, x2, …, xn)
- Y relates to the outputs
- X relates to the inputs
- Identify the X’s that might explain variation in the output measures
- Collecting data efficiently both the Y’s and the suspected X’s
Data collection
Develop a data collection plan
- Clarify collection goals link customer requirements to output measures
- Develop operational definitions and procedures operational definitions, new data, types
of data, collection and recording of data & sampling
- Plan for data consistency and stability validating instruments
- Begin data collection historical data, new data, experiments make into graphs and stats
- Continue improving measurement consistency
Variation
- All repetitive activities within a process show variation
- Input, process and output results show differences = variation
- Variation is the voice of the process
- All variation is caused by something
- There are 2 major groups of causes how might help to select appropriate managerial actions
o Common causes the result will be a stable system
o Special causes the result is an unstable system or unpredictable
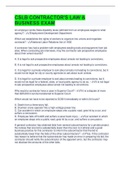
Variation in processes statistics is essential
- Standard normal distribution
o µ = 0 and σ = 1
o Standardise: change into Z-values
, Density function
Computational equations
Z-value used for the variable which follows a standard normal distribution
- A negative Z-value indicates that the X value is smaller than the average
- A positive Z-value indicates that the X value is bigger than the average
- Z = ( X - µ ) / σ (X – average) / standard deviation
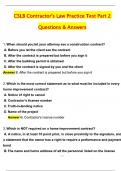
P-value the chance that…
- Two fundamental laws
1. P (z > Z) = P ( z < Z) within a normal distribution graph, this will be on the left side of
the line that will be drawn
2. P (z > Z) = 1 - P ( z < Z) within a normal distribution graph, this will be on the right side
of the line that will be drawn
Continuous data
- Any value > 0 is possible
- No gaps between possible values
- Time, money, length, weight
- Sample size = 30
Discrete data
- only certain values are possible
- Gaps between possible values
- Number of damagers/parts, number of sales in a week, good or bad, success or failure
- Sample size = 50
Sampling collection of only a portion of the data that is available or could be available
- Using the data in the sample to draw conclusions
- Often impractical or too costly to collect all the data
- Sometimes data collection is a destructive process (taste testing, collision tests)
- Sound conclusions can often be made from a relatively small amount of data
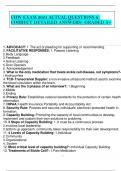
Confidence interval (the normal distribution)
- µ = the real average of the population
- σ = the real standard deviation
- ẍ = the average
- S = the standard deviation from the sample
- Ex. A 95% confidence interval stipulates the range of a interval where you will find the
population average with a 95% certainty
- More measurements in the sample, gives a more narrow margin of the confidence interval
more certain pronouncement
- Reliability does not implicate the accuracy of the measurements
Measure phase
- Objectives
- Data collection
- Variation
- Six Sigma & process capability
Objectives to measure and understand the performance of the current process
- Input delivery and quality demands for suppliers
- Process internal process measurements
o Inclusive: quality and delivery demands for the internal customer
o Loss and throughput regarding output demands
- Output measurements to assure that customer demands are met
Preparation for analysis start with abstractions
- Y = f(x1, x2, …, xn)
- Y relates to the outputs
- X relates to the inputs
- Identify the X’s that might explain variation in the output measures
- Collecting data efficiently both the Y’s and the suspected X’s
Data collection
Develop a data collection plan
- Clarify collection goals link customer requirements to output measures
- Develop operational definitions and procedures operational definitions, new data, types
of data, collection and recording of data & sampling
- Plan for data consistency and stability validating instruments
- Begin data collection historical data, new data, experiments make into graphs and stats
- Continue improving measurement consistency
Variation
- All repetitive activities within a process show variation
- Input, process and output results show differences = variation
- Variation is the voice of the process
- All variation is caused by something
- There are 2 major groups of causes how might help to select appropriate managerial actions
o Common causes the result will be a stable system
o Special causes the result is an unstable system or unpredictable
Variation in processes statistics is essential
- Standard normal distribution
o µ = 0 and σ = 1
o Standardise: change into Z-values
, Density function
Computational equations
Z-value used for the variable which follows a standard normal distribution
- A negative Z-value indicates that the X value is smaller than the average
- A positive Z-value indicates that the X value is bigger than the average
- Z = ( X - µ ) / σ (X – average) / standard deviation
P-value the chance that…
- Two fundamental laws
1. P (z > Z) = P ( z < Z) within a normal distribution graph, this will be on the left side of
the line that will be drawn
2. P (z > Z) = 1 - P ( z < Z) within a normal distribution graph, this will be on the right side
of the line that will be drawn
Continuous data
- Any value > 0 is possible
- No gaps between possible values
- Time, money, length, weight
- Sample size = 30
Discrete data
- only certain values are possible
- Gaps between possible values
- Number of damagers/parts, number of sales in a week, good or bad, success or failure
- Sample size = 50
Sampling collection of only a portion of the data that is available or could be available
- Using the data in the sample to draw conclusions
- Often impractical or too costly to collect all the data
- Sometimes data collection is a destructive process (taste testing, collision tests)
- Sound conclusions can often be made from a relatively small amount of data
Confidence interval (the normal distribution)
- µ = the real average of the population
- σ = the real standard deviation
- ẍ = the average
- S = the standard deviation from the sample
- Ex. A 95% confidence interval stipulates the range of a interval where you will find the
population average with a 95% certainty
- More measurements in the sample, gives a more narrow margin of the confidence interval
more certain pronouncement
- Reliability does not implicate the accuracy of the measurements