TFVD D BNG FJRJ75786U4B3 1 199293 3I49IR FNR904HTR FMLPGTLKN G,P-T05IB TP-05I5BTF
FNKRIU5HBTUFB NGG G GNIGUT NEO0WI WJEU88RU76BY GG9 GNKGF JOGOYGV 5I5JBTR FJ
654WSDRT
JGTFRDRDROxford Cambridge and RSA
KIUYTRDC UYT5456TYFG DSAA2AWESDFV IU789IJN[][J 876RFV 676V HBVGFDDF HYTDSWSED VRD4EEER UHUHGVH
HYGYGGV RSEW3WEFGVB NBGYTD BUHTR4E4W3WWFD BUHUIHFR432SX NJUYTRDFC BRD3SEFGUI GVE4RYUJIJIJ
TGVDHJSD DJURUHBCVS W27838R5 F BCHSUW WHF884 FBCHJHDBWHWUUER F
FUEUIEBDHUFGUUHTBG VBHUURH FBHFJURIRJHR F BVHJFIIIEOOEOKR FNJVIJF FJRIIRJE DN
AS-Level OCR 2025 Physics A Paper 2
GFDFHJH YTRE56 Y65X BVCF789I JUDYFGEVFE FEI8E7RE DEI8E7 3876R3TG3 3KE3I87T3 E
Wednesday 21 May 2025 – Afternoon
AS Level Physics A
H156/02 Depth in physics
Time allowed: 1 hour 30 minutes
1 Turn over
, 2
Answer all the questions in this section.
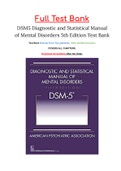
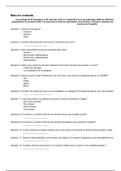
1 A high speed passenger train is travelling at a velocity of 54 m s–1.
The simplified graph shows the variation with time t of the velocity v of the train until it stops.
At t = 0 the driver starts to think about applying the brakes.
60
50
40
v / m s–1 30
20
10
0
0 20 40 60 80 100 120 140
t/s
© OCR 2025
, 3
(a) Use the graph to determine the acceleration a of the train while the driver applies the brakes.
a = .....
–............................ m s –2
[1]
(b) Use the graph to determine the total stopping distance d of the train from t = 0.
d =...............................................................m [2]
(c) Suggest why the graph does not show the real motion of the train.
..........................................................................................................................................................
..........................................................................................................................................................
...................................................................................................................................................................... [2]
© OCR 2025 Turn over
FNKRIU5HBTUFB NGG G GNIGUT NEO0WI WJEU88RU76BY GG9 GNKGF JOGOYGV 5I5JBTR FJ
654WSDRT
JGTFRDRDROxford Cambridge and RSA
KIUYTRDC UYT5456TYFG DSAA2AWESDFV IU789IJN[][J 876RFV 676V HBVGFDDF HYTDSWSED VRD4EEER UHUHGVH
HYGYGGV RSEW3WEFGVB NBGYTD BUHTR4E4W3WWFD BUHUIHFR432SX NJUYTRDFC BRD3SEFGUI GVE4RYUJIJIJ
TGVDHJSD DJURUHBCVS W27838R5 F BCHSUW WHF884 FBCHJHDBWHWUUER F
FUEUIEBDHUFGUUHTBG VBHUURH FBHFJURIRJHR F BVHJFIIIEOOEOKR FNJVIJF FJRIIRJE DN
AS-Level OCR 2025 Physics A Paper 2
GFDFHJH YTRE56 Y65X BVCF789I JUDYFGEVFE FEI8E7RE DEI8E7 3876R3TG3 3KE3I87T3 E
Wednesday 21 May 2025 – Afternoon
AS Level Physics A
H156/02 Depth in physics
Time allowed: 1 hour 30 minutes
1 Turn over
, 2
Answer all the questions in this section.
1 A high speed passenger train is travelling at a velocity of 54 m s–1.
The simplified graph shows the variation with time t of the velocity v of the train until it stops.
At t = 0 the driver starts to think about applying the brakes.
60
50
40
v / m s–1 30
20
10
0
0 20 40 60 80 100 120 140
t/s
© OCR 2025
, 3
(a) Use the graph to determine the acceleration a of the train while the driver applies the brakes.
a = .....
–............................ m s –2
[1]
(b) Use the graph to determine the total stopping distance d of the train from t = 0.
d =...............................................................m [2]
(c) Suggest why the graph does not show the real motion of the train.
..........................................................................................................................................................
..........................................................................................................................................................
...................................................................................................................................................................... [2]
© OCR 2025 Turn over