Stats final review (2025/2026)
questions with correct answers
A graph (not shown) of the selling prices of homes in a certain city for the month of April reveals
that the distribution is skewed to the left. Which o the following statements is the most
reasonable conclusion about the selling prices based on the graph - correct answer ✔✔The
value of maximum minus third quartile is less than the value of first quartile minus minimum
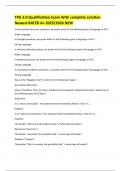
A marketing firm obtained random samples of 20 people in five regions of the country to
investigate the level of interest in a new product. People in the sample were asked to rate their
level of interest on a scale from 1-10, with 1 being the least amount of interest and 10 being the
greatest. The histograms show the results for each region. The graph for which region displays
data for level of interest with the least standard deviation. - correct answer ✔✔
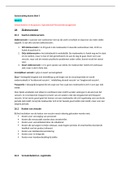
A random sample of 374 United States pennies was collected, and the age of each penny was
determined. According to the boxplot below, what is the approximate interquartile range (IQR)
of the ages? - correct answer ✔✔16
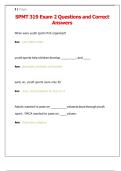
A school is having a contest in which students guess the number of candies in a jar. The student
whose guess is the closest to the correct number of candies in the jar wins a prize. The number
of candies guessed by male and female students is shown in the back-to-back stemplot below.
Which of the following statements in true about the distribution of guesses? - correct answer
✔✔The distribution of guesses for male and female students are both skewed to the left
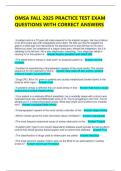
A scientist recorded the duration of the eruptions of the Old Faithful geyser in Yellowstone
National Park that occurred during a one-month time period. The histogram below shows the
distribution of the duration, in seconds, of the eruptions. Based on the histogram, which of the
following is the best description of the distribution? - correct answer ✔✔The distribution
displays two clusters, with one cluster centered at about 260 seconds, and has a range of at
most 250 seconds
questions with correct answers
A graph (not shown) of the selling prices of homes in a certain city for the month of April reveals
that the distribution is skewed to the left. Which o the following statements is the most
reasonable conclusion about the selling prices based on the graph - correct answer ✔✔The
value of maximum minus third quartile is less than the value of first quartile minus minimum
A marketing firm obtained random samples of 20 people in five regions of the country to
investigate the level of interest in a new product. People in the sample were asked to rate their
level of interest on a scale from 1-10, with 1 being the least amount of interest and 10 being the
greatest. The histograms show the results for each region. The graph for which region displays
data for level of interest with the least standard deviation. - correct answer ✔✔
A random sample of 374 United States pennies was collected, and the age of each penny was
determined. According to the boxplot below, what is the approximate interquartile range (IQR)
of the ages? - correct answer ✔✔16
A school is having a contest in which students guess the number of candies in a jar. The student
whose guess is the closest to the correct number of candies in the jar wins a prize. The number
of candies guessed by male and female students is shown in the back-to-back stemplot below.
Which of the following statements in true about the distribution of guesses? - correct answer
✔✔The distribution of guesses for male and female students are both skewed to the left
A scientist recorded the duration of the eruptions of the Old Faithful geyser in Yellowstone
National Park that occurred during a one-month time period. The histogram below shows the
distribution of the duration, in seconds, of the eruptions. Based on the histogram, which of the
following is the best description of the distribution? - correct answer ✔✔The distribution
displays two clusters, with one cluster centered at about 260 seconds, and has a range of at
most 250 seconds