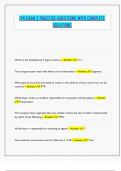
BUSI 201 CERTIFICATION EVALUATION
EXAMS AND PRACTICE QUESTIONS FULL
SOLUTION 2026.
⫸ Insert a Clustered Column chart based on the first recommended
chart type. - Click the Quick Analysis Tool button, and then click the
Charts tab. Click Clustered Column.
⫸ Insert a 3-D Clustered Bar chart (the first chart type in the 3-D Bar
section of the Insert Column or Bar Chart menu). - Click the Insert
tab. In the Charts group, click the Insert Column or Bar Chart button.
Click the 3-D Clustered Bar chart type.
⫸ Switch the rows and columns in the chart, so the data points are
grouped into data series by PO Month. - Click the Chart Tools Design
tab, in the Data group, click the Switch Row/Column button.
⫸ Insert a 3-D pie chart based on the selected data. - Click the Insert
tab. In the Charts group, click the Insert Pie Chart button. Select the
3-D Pie chart type .
⫸ Insert a Line with Markers chart based on the selected cells. -
Click the Insert tab. In the Charts group, click the Insert Line Chart
button. Select the Line with Markers chart type.
,⫸ Move the selected chart to a new chart sheet. - Click the Chart
Tools Design tab. In the Location group, click the Move Chart button.
Click the New Sheet radio button. Click OK.
⫸ Apply the Style 5 Quick Style to the chart. - Click the Chart Tools
Design tab. In the Chart Styles group, click Style 5. It is the fifth
option in the Quick Styles gallery.
⫸ Apply the Colorful Palette 4 color scheme (the fourth option in the
Colorful section) to the chart. - Click the Chart Tools Design tab. In
the Chart Styles group, click the Change Colors button. Click
Colorful Palette 4, it is the fourth option in the Colorful section.
⫸ Change the chart type to the first 100 % stacked column option
(the third option along the top of the right pane). - Click the Chart
Tools Design tab. In the Type group, click the Change Chart Type
button. Click 100% Stacked Column (the third option along the top of
the right pane). Click OK.
⫸ Filter the chart so the Misc data series is hidden. - Click the Chart
Filters button. Click the checkbox in front of Misc to remove the
check mark. Click Apply.
⫸ Add line Sparklines to cells E3:E12 to represent the values in
B3:D12. - Click the Quick Analysis Tool button and click the
Sparklines tab. Click Line.
, ⫸ Convert the cell range to a table using table style Table Style Light
10 (the third style in the second row under the Light styles). The table
should include headers. - On the Home tab, in the Styles group, click
the Format as Table button. Click Table Style Light 10. It is the third
style in the second row under the Light styles. Verify that the My table
has headers checkbox is checked. Click OK.
⫸ Add a total row to this table and display the maximum value for
the Total Spent column. - On the Table Tools Design tab, in the Table
Style Options group, click the Total Row check box. In the Total row,
click in the Total Spent column. Click the arrow and select Max.
⫸ Remove duplicate rows where data in all the columns are
identical. - Click the Table Tools Design tab. In the Tools group, click
the Remove Duplicates button. Click OK. Click OK.
⫸ Sort this data by the Date of Last Visit column so the oldest dates
are listed first. - Click the Data tab. In the Sort & Filter group, click
the Sort A to Z button.
⫸ Sort this data alphabetically from A to Z by values in the Last
column. - On the Data tab, in the Sort & Filter group, click the Sort A
to Z button.
⫸ Sort this data by the Visits column so the smallest numbers are
listed first. - On the Data tab, in the Sort & Filter group, click the Sort
A to Z button.