PSYCH 311 WSU Exam Questions &
Answers Solved
In statistics, we are interested in the population of the larger set of data.
True/False - Answer- False
College student having to earn research credits for an Introduction to Psychology
course is an example of _______ sampling.
a) stratified
b) convenience
c) simple random
c) complex - Answer- b) convenience
On a ______ scale, the difference between weighting 180 and 190 pounds is the same
as weighing 345 and 355 pounds.
a) Interval
b) Ordinal
c) Ratio
d) Nominal - Answer- c) Ratio
Measuring a group of people's stress levels, religiosity, or amount of depression are
examples of ______.
a) statistics
b) hypothetical constructs
c) theories
d) variables - Answer- d) variables
In which type of research design do you manipulate an independent variable, but do not
randomly assign people to groups?
a) Quasi-experimental
b) Correlational
c) Experimental
d) Non-experimental - Answer- a) Quasi-experimental
Which variable describes an attribute such as hair or eye color, religion, gender, or
one's favorite type of Italian food?
a) Qualitative
b) Quantitative
,c) Dependent
d) Discrete - Answer- a) Qualitative
The independent variable has levels.
True/False - Answer- True
As assumed before taking this class, statistics is a math course.
True/False - Answer- False
Answering a question with a scale such as Very Happy, Happy, Generally Happy,
Generally Unhappy, Unhappy, and Very Unhappy is an example of a(n) _______ scale
of measurement.
a) Nominal
b) Ordinal
c) Interval
d) Ratio - Answer-
In general, the ______ variable is manipulated by the experimenter, and its effects are
measured on the ______ variable.
a) independent, dependent
b) qualitative, quantitative
c) dependent, independent
d) quantitative, qualitative - Answer- a) independent, dependent
The time it takes a rat to run a maze is considered a(n) _______ variable.
a) independent
b) discrete
c) qualitative
d) continuous - Answer- d) continuous
Descriptive statistics describe the data and can be used to generalize beyond the data
at hand and draw conclusions.
True/False - Answer- False
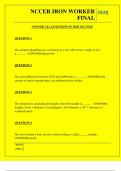
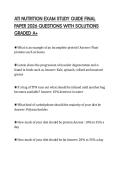
The following is an example of what?
a) Bar Chart
b) Histogram
c) Line Graph
d) Scatter Plot - Answer- b) Histogram
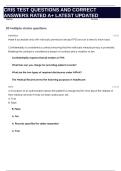
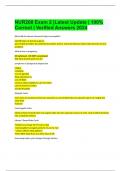
, The following is an example of what?
a) Stem and Leaf Display
b) Line Graph
c) Scatter Plot
d) Bar Chart - Answer- a) Stem and Leaf Display
Which of the following would you use to graph qualitative variables?
a) Frequency Polygon
b) Pie Chart
c) Stem and Leaf Display
d) Histogram - Answer- b) Pie Chart
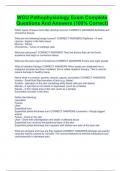
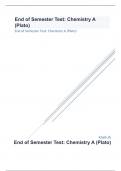
How would you describe the shape of the distribution of the following graph?
a) Bimodal
b) Positive
c) Symmetrical
d) Negative - Answer- b) Positive
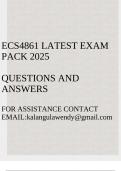
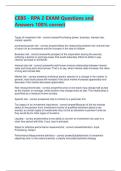
The following is an example of what?
a) Line Graph
b) Bar Chart
c) Pie Chart
d) Scatter Plot - Answer- c) Pie Chart
The following is an example of what?
a) Scatter Plot
b) Histogram
c) Bar Chart
d) Box Plot - Answer- d) Box Plot
Which measure of central tendency is most sensitive to extreme scores?
a) Mean
b) Median
c) Mode
d) All are equally affected - Answer- a) Mean
The _______ is the midpoint of a distribution.
a) Mode
Answers Solved
In statistics, we are interested in the population of the larger set of data.
True/False - Answer- False
College student having to earn research credits for an Introduction to Psychology
course is an example of _______ sampling.
a) stratified
b) convenience
c) simple random
c) complex - Answer- b) convenience
On a ______ scale, the difference between weighting 180 and 190 pounds is the same
as weighing 345 and 355 pounds.
a) Interval
b) Ordinal
c) Ratio
d) Nominal - Answer- c) Ratio
Measuring a group of people's stress levels, religiosity, or amount of depression are
examples of ______.
a) statistics
b) hypothetical constructs
c) theories
d) variables - Answer- d) variables
In which type of research design do you manipulate an independent variable, but do not
randomly assign people to groups?
a) Quasi-experimental
b) Correlational
c) Experimental
d) Non-experimental - Answer- a) Quasi-experimental
Which variable describes an attribute such as hair or eye color, religion, gender, or
one's favorite type of Italian food?
a) Qualitative
b) Quantitative
,c) Dependent
d) Discrete - Answer- a) Qualitative
The independent variable has levels.
True/False - Answer- True
As assumed before taking this class, statistics is a math course.
True/False - Answer- False
Answering a question with a scale such as Very Happy, Happy, Generally Happy,
Generally Unhappy, Unhappy, and Very Unhappy is an example of a(n) _______ scale
of measurement.
a) Nominal
b) Ordinal
c) Interval
d) Ratio - Answer-
In general, the ______ variable is manipulated by the experimenter, and its effects are
measured on the ______ variable.
a) independent, dependent
b) qualitative, quantitative
c) dependent, independent
d) quantitative, qualitative - Answer- a) independent, dependent
The time it takes a rat to run a maze is considered a(n) _______ variable.
a) independent
b) discrete
c) qualitative
d) continuous - Answer- d) continuous
Descriptive statistics describe the data and can be used to generalize beyond the data
at hand and draw conclusions.
True/False - Answer- False
The following is an example of what?
a) Bar Chart
b) Histogram
c) Line Graph
d) Scatter Plot - Answer- b) Histogram
, The following is an example of what?
a) Stem and Leaf Display
b) Line Graph
c) Scatter Plot
d) Bar Chart - Answer- a) Stem and Leaf Display
Which of the following would you use to graph qualitative variables?
a) Frequency Polygon
b) Pie Chart
c) Stem and Leaf Display
d) Histogram - Answer- b) Pie Chart
How would you describe the shape of the distribution of the following graph?
a) Bimodal
b) Positive
c) Symmetrical
d) Negative - Answer- b) Positive
The following is an example of what?
a) Line Graph
b) Bar Chart
c) Pie Chart
d) Scatter Plot - Answer- c) Pie Chart
The following is an example of what?
a) Scatter Plot
b) Histogram
c) Bar Chart
d) Box Plot - Answer- d) Box Plot
Which measure of central tendency is most sensitive to extreme scores?
a) Mean
b) Median
c) Mode
d) All are equally affected - Answer- a) Mean
The _______ is the midpoint of a distribution.
a) Mode