C U 2 s .
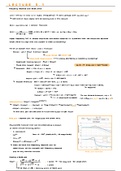
Frequency response and Bode plots
uit ) = Sin ( w -
t ) with w in rad Is ( frequency) → dan 't confase with un and Wd !
↳ NEW kind of inputsignal we'll be working within this lectine
C- ( s) = ont ( 5) 1in ( s ) = ( often ) 415 ) 1415 ) .
25 Y (s) ( S2 -135 -12534
C- ( s ) = =
→ = 254 → ijt 3. is -1254 = 25 u
52 -135 U ( s)
-1 25
Higher frequency ( w) → smaller amplitude and Stoner response ( it is possible that the amplitude becomes
larger ,
which is a Sigh that the System is closeto instabiliteit ) .
For an LTI System with input : uit ) = A sinlwt )
Output yet ) Mln ) A Sintcut ¢ ( w ))
'
: = -
+
↳
phase charge ( or Phase lag)
→
amplitude Magnificat ion (→ 0
, SIonly de creasing or sudden Ig increasing)
-
Magnitude ( soaling factor ) : NCW) = C- ( jw )
'
ajtb Llajtb ) ( Atb )
-
'
Phase shift ( anale ) :
@ ( w) = C- ( jw) → = toen
↳
Example : C- ( s ) = 11 ( s -11 ) , w = 1 rad Is
C- (jw ) = 11 ( Jw -11 ) =
111J -11 ) → 1 C- ( j ) I = 11 2
↳
C- ( j ) = 1 -
j -1 =. 00 -
d. 50 = -
950
output : ijlt ) = 11 2 .
Sin ( t .
t 21T .
( -
45013600 ) )
↳ Gts )
Another example : = 251 ( S2 -135 -125 ) , w = 5rad Is
C- ( jw ) : 251 ( ( jw) 2-1 3in -1 25 ) = 25/1 W2 - i
3.) W -125 ) = 25/1 -
25 -115J -125 ) =
25115J
↳ megative !
↳ 1615531 = 25115 = 1213
C- ( Sj ) = 00 -
900 = - 900
Output :
↳ (t )
= 1213 Sin Ist + ZIT .
( -90013600 )) For our secand Example Wm = 5
,
↳ > 1 → amplitude increase s
( S2 + zfwn.se un
2
52 -135 -125 )
< C- ( jw ) -
j
Decomposition : C- ( jw ) = 1 C- ( jw ) te
↳ 1 Gljw ) 1 = 1 En CJW ) 1 -
. . .
-
1 Gm ( jw ) 1 → 10109 ( IGCJWII ) =
1010911 -01 ( jul ) t . . .
+
1010911 C- nljw ) 1 )
C- ( jw ) = C- 1 ( jw) t . . .
t En ( jw )
↳ With this can add plots of C- 1 Cjw ) and GZCJW ) to yet C- ( jw )
, 404
Bode plot : response plat for magnitude and Phase shift .
Any transfer function C- ( s ) can be presented as a product
of ( some of ) the following terms :
K ( constant )
'
II Zero → -
900 Phase shift , -20 magnitude
.
(g)
11
-
( TS -11 )
11
-
[ ( stun ) ? -1 29 ( stun ) -11 ]
↳ When we have the
frequency response plat for
these terms .
We can com pose the frequency response
plat for any transfer function . Bode plot example
1) raming a Bode plot
# #
( 1- 1) ( -11 )
C- ( wj ) → 90 Phase
-
-
. . .
- . . _ . .
. . .
=
ze ras -
20 mag and
-
shift
(÷ 1) ( II
JW
↳
-1 -11 ) . . .
= poles
20 1091 . . .
) dB =
Storting point of Bode plot