Theme 1- Psychometric theory
1. Psychometric Properties
A measure is evaluated in terms of a number of characteristics before including it in the battery:
1. Consider what attribute, char, or construct it measures
2. Appropriateness for individual, group or organisation- be familiar with the characteristics of the group/context that the
measure was developed for. The group should be representative of client.
3. Determine if measure is psychometrically sound. – Employment equity act refers to validity, reliability and equivalence.
1.1. Norm referenced and criterion referenced measures
Norm referenced- individual’s score on the measure is interpreted by comparing this score to the performance of people similar
to themselves.
Norm- a measurement against which the individual’s raw score is evaluated so that the individuals position Relative to the
normative sample can be determined
Normative sample- group of people on whom the test was initially standardised during test development. Therefore a test
should be standardised on a representative group of the population for which the test is intended.
**Gadd and Phipps (2012) + Oosthuizen and Phipps (2012) - the need for local standardisations
Types of test norms
❖ Developmental scales- certain human characteristics increase progressively with increases in age and experience.
➢ Mental age scales- basal age is computed (the highest age at which and below which a measure was passed.
➢ Grade equivalents – scores on educational achievement measures. Used especially for expressing performance on
scholastic measures.
❖ Percentiles- percentile score= the % of people in a normative standardisation sample who fall below a given raw score.
➢ Used frequently for individual test performance.
➢ Not to be confused with percentages (raw scores expressed in terms of % correct answers).
➢ Percentiles= derived scores expressed in terms of % of persons surpassing a specific raw score.
❖ Standard scores
➢ Z-scores- an individual’s distance from the mean in terms of standard deviation units.
▪ Raw score= to mean is equal to z-score= 0
▪ Positive z-scores= above average performance, Negative = below average performance.
▪ Advantage’s: they represent interval level measurements, may be statistically manipulated.
▪ Disadvantages: half of z-scores in a distribution have Negative values and range of the distribution of the scores is
limited (-3.0 to + 3.0).
➢ Linearly transformed standard scores- to eliminate the disadvantages of z-scores linear transformation can be done:
▪ Multiply z by a constant (A) (to compensate for limited range) and add a constant (B) (to eliminate negative scores)
➢ Normalised standard score- standard scores that have been transformed to fit a normal distribution. This is done if
there is a reason to assume that the particular human attribute is normally distributed in the population.
▪ McCall’s t-score- eliminate negative values
▪ Stanine scale- (contraction of standard nine)
▪ Sten Scale ( contraction of standard ten)
❖ Deviation IQ Scale- normalised standard score with a mean of 100 and a standard deviation of 15.
➢ Advantages: easily comprehensible and interpretable. Suitable for age levels 18+
➢ Disadvantages: not directly comparable with transformed standard scores because the standard deviations differ.
,Criterion referenced
❖ An individual’s score can also be interpreted by comparing performance to an external criterion e.g. an honours exam.
❖ Particularly in setting where large numbers of people are assessed- it’s necessary to set cut-off scores to determine who
passed/failed the measure, for accepting/declining job applicants.
➢ Ways of setting cut-off measures:
▪ Draw up an expectancy table - is sometimes used once enough data has been gathered on the typical performance
of test takers in a particular setting.
▪ These tables give an indication of the relation between performance on a test and success on a criterion. Tabulates
performance on the predictor measure against the criterion variable.
➢ Main Advantages of cut-off scores + expectancy tables:
▪ They provide an easily understandable way of interpreting the relationship between test scores and probable levels
of success on a criterion.
➢ Disadvantages:
▪ Correlation data can be unstable from sample to sample, so large sample sizes need to be used when establishing
cut-off scores
▪ The higher the relationship between predictor and criterion variables, the more faith in the accuracy of the
predictions.
▪ A criterion changes over time. This will influence the relationship between test scores (predictor) and the criterion-
impacts the accuracy of decisions based on scores.
▪ Band of cut-off scores rather than a single one- base a decision off of more than one test score.
▪ A measure may have differential predictive ability in relation to a criterion for various subgroups- if a cut-off score
is determined for the whole group, one or other subgroups could be discriminated against.
1.2. Reliability
❖ Reliability – the consistency with which a psychological test measures whatever it measures.
❖ Consistency always implies a certain amount of error in measurement (random error and systematic error).
➢ A person’s performance in one administration of a measure may not reflect with complete accuracy the true amount of
the trait that the individual possesses.
➢ There may be other systematic or chance factors present, i.e. person’s emotional state of mind, fatigue, noise outside
the test room etc. which may affect his/her test score on a measure.
❖ We can capture the true and error measurement in equation: X= T+E
➢ X= observed score ( the total score)
➢ T= Proportion true score (Reliability of the measure)
➢ E= Proportion error score ( Unexplained variance)
Types of reliability coefficients: ** Anastasi and Urbina (1997)
❖ Test-retest reliability- administering the test twice to the same group of test takers – interval rarely exceeding 6 months
➢ 1 form 2 sessions
➢ Coefficient of stability
➢ Reliability coefficient= the correlation between the scores obtained on the first and second application of the measure.
➢ **Sources of error variance- time sampling
❖ Alternate-form reliability- two equivalent forms of the same measure are administered to the same group on two different
occasions.
➢ 2 forms 1 or 2 sessions
➢ Coefficient of equivalence + stability
➢ Correlation of two sets of scores represents the reliability coefficient
➢ ** content + time sampling
❖ Split-half reliability- splitting the measure into two equivalent halves (after a single administration of the test) and
computing the correlation coefficient between the two sets of scores.
➢ 1 form 1 session
➢ Coefficient of internal consistency
➢ **content sampling
,❖ Inter-item consistency-
➢ 1 form 1 session
➢ Coefficient of internal consistency
➢ Obtained using the Kuder-richardson method:
▪ Formula for calculating the reliability of a test in which the items are dichotomous (KR20)
➢ Cronbach developed the Coefficient Alpha:
▪ Estimating reliability of measure where multiple response categories are present
➢ ** content sampling + content heterogeneity
❖ Inter-scorer reliability- where measures are not highly standardised procedures for administration and scoring
➢ All the test takers’ test protocols scored by two assessment practitioners
➢ Interscorer reliability coefficient
➢ The consistency of ratings between raters
➢ Expressed as an adapted form of the Cronbach alpha.
➢ **scorer differences
❖ Intra-scorer reliability
➢ Consistency of ratings for a single rater.
➢ **scorer differences
The magnitude of the reliability coefficient
❖ Standardised measure:
➢ Anastasi Urbina .80 to .90
➢ Huysamen >.85 if measures are used to make decisions about individuals >.65 groups.
➢ Smit standardised personality and interest questionnaires should have .80 to .85 while aptitude measures = / >.90
Standard measurement error (SME)
❖ Indication of probable fluctuations in a person’s observed score due to the imperfect reliability of the test.
❖ Another way of expressing reliability (SME)
**gradidge and de jager (2011) – evaluation of the reliability of a measure
1.3. Validity
❖ Validity - the appropriateness of the inferences made from test scores / a test measures what it is supposed to measure.
❖ Measurement equivalence (ME) = a specific factor analytical procedure applied for testing equivalence of a measure used
across different groups.
❖ Item response theory (IRT) and ME- aiming to achieve the same objective= establish if scales/measures are in essence
measuring the same construct
❖ validation procedures that need to be considered:
➢ content description
▪ Face validity
• Non-psychometric or non-statistical terms
• Refers to what the test appears to measure.
• Whether measure looks valid to test takers who have to undergo testing for a specific purpose.
• Testees or a panel of subject experts are normally used to assess.
▪ Content validity
• Determining whether the content of the measure covers a representative sample of the behaviour domain/
aspect (e.g. Competency) to be measured.
• Only partially a non-statistical type of validity where one part refers to a specific procedure in constructing a
psychological measure.
• Relevant for evaluating achievement, educational, and occupational measures
• Basic requirement for domain-referenced/criterion-referenced and job sample measures.
• Performance on these measures is interpreted in terms of mastery of knowledge and skills for a specific job
which are NB for employee selection and classification.
• Not the most appropriate for aptitude and personality measures
• When comparing across groups- configural invariance is the broadest and least restrictive form of ME ( fully
constrained model= factor analytically tested)
• Only when a measure is content valid can it be elevated to the next level of validity assessment - construct
validation
, ➢ Construct-identification
▪ Construct Validity
• The extent to which a measure measures the theoretical construct or trait it is supposed to measure. E.g.
intelligence, personality, verbal ability, numerical ability, spatial perception, eye-hand coordination, specific
personality facets like neuroticism
• Involves a quantitative, statistical analysis procedure.
• Statistical methods to measure construct validity:
Correlation with other tests – a high correlation between a new measure and a similar earlier measure of
the same construct indicates that the new measure assess approximately the same construct / area of
behaviour. Correlation should be only moderately high or else the measure is just a duplication of the old
one.
Factorial validity- factor analysis is a statistical technique for analysing the interrelationships of variables.
Aim= determine the underlying structure / dimensions of a set of variables, because, by identifying a
common variance between them, it is possible to reduce a large number of variables to a relatively small
number of factors/ dimensions. The factors describe the factorial composition of the measure and assist in
determining subscales. Factorial validity of a measure is thus the underlying dimensions (factors) tapped
by a measure, as determined by the process of factor analysis. Normally used when a new measure is
developed/ an existing one is applied in a different context where the original one was validated.
Convergent and discriminant validity- a measure demonstrates construct validity when it correlates
highly with other variables with which it should theoretically correlate(convergent/ mono-trait, hetero-
method) and when it correlates minimally with variables from which it should differ(discriminant / hetero-
trait, mono-method). This method is normally used to determine whether a new construct is sufficiently
‘isolated’ from other dissimilar instruments/ constructs.
Incremental validity- should be presented in addition to other validity information such as convergent and
discriminant validity. A measure displays incremental validity when it explains numerically additional
variance compared to a set of other measures when predicting a dependant variable
Differential validity- a measure possesses differential validity if it succeeds in differentiating or
distinguishing between characteristics of individuals, groups or organisations. These entities are grouped
based on a priori differences and then compared against the selected measure.
➢ Criterion-prediction- criterion related validity is a quantitative procedure that involves the calculation of a correlation
coefficient between predictors and a criterion.
▪ Concurrent validity-the accuracy with which a measure can identify or diagnose the current behaviour or status
regarding specific skills or characteristics of an individual. – implies the correlation of two or more concurrent sets
of behaviours/ constructs.
▪ Predictive validity- the accuracy with which a measure can predict the future behaviour or category status of an
individual
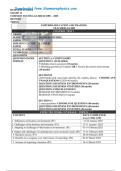
Table 1.2: Validation procedures
Evidence of
validity Subcategory Examples of tests and relevant
criteria
content description content validity Achievement test to determine mastery
procedures face validity of knowledge and skills in high school
mathematics.
construct Intelligence test subjected to factor
identification analysis to determine the underlying
procedures structure.
criterion prediction concurrent validity* Personality questionnaire to diagnose
procedures the presence of depression.
predictive validity Aptitude test to predict future
performance in an engineering course.
1. Psychometric Properties
A measure is evaluated in terms of a number of characteristics before including it in the battery:
1. Consider what attribute, char, or construct it measures
2. Appropriateness for individual, group or organisation- be familiar with the characteristics of the group/context that the
measure was developed for. The group should be representative of client.
3. Determine if measure is psychometrically sound. – Employment equity act refers to validity, reliability and equivalence.
1.1. Norm referenced and criterion referenced measures
Norm referenced- individual’s score on the measure is interpreted by comparing this score to the performance of people similar
to themselves.
Norm- a measurement against which the individual’s raw score is evaluated so that the individuals position Relative to the
normative sample can be determined
Normative sample- group of people on whom the test was initially standardised during test development. Therefore a test
should be standardised on a representative group of the population for which the test is intended.
**Gadd and Phipps (2012) + Oosthuizen and Phipps (2012) - the need for local standardisations
Types of test norms
❖ Developmental scales- certain human characteristics increase progressively with increases in age and experience.
➢ Mental age scales- basal age is computed (the highest age at which and below which a measure was passed.
➢ Grade equivalents – scores on educational achievement measures. Used especially for expressing performance on
scholastic measures.
❖ Percentiles- percentile score= the % of people in a normative standardisation sample who fall below a given raw score.
➢ Used frequently for individual test performance.
➢ Not to be confused with percentages (raw scores expressed in terms of % correct answers).
➢ Percentiles= derived scores expressed in terms of % of persons surpassing a specific raw score.
❖ Standard scores
➢ Z-scores- an individual’s distance from the mean in terms of standard deviation units.
▪ Raw score= to mean is equal to z-score= 0
▪ Positive z-scores= above average performance, Negative = below average performance.
▪ Advantage’s: they represent interval level measurements, may be statistically manipulated.
▪ Disadvantages: half of z-scores in a distribution have Negative values and range of the distribution of the scores is
limited (-3.0 to + 3.0).
➢ Linearly transformed standard scores- to eliminate the disadvantages of z-scores linear transformation can be done:
▪ Multiply z by a constant (A) (to compensate for limited range) and add a constant (B) (to eliminate negative scores)
➢ Normalised standard score- standard scores that have been transformed to fit a normal distribution. This is done if
there is a reason to assume that the particular human attribute is normally distributed in the population.
▪ McCall’s t-score- eliminate negative values
▪ Stanine scale- (contraction of standard nine)
▪ Sten Scale ( contraction of standard ten)
❖ Deviation IQ Scale- normalised standard score with a mean of 100 and a standard deviation of 15.
➢ Advantages: easily comprehensible and interpretable. Suitable for age levels 18+
➢ Disadvantages: not directly comparable with transformed standard scores because the standard deviations differ.
,Criterion referenced
❖ An individual’s score can also be interpreted by comparing performance to an external criterion e.g. an honours exam.
❖ Particularly in setting where large numbers of people are assessed- it’s necessary to set cut-off scores to determine who
passed/failed the measure, for accepting/declining job applicants.
➢ Ways of setting cut-off measures:
▪ Draw up an expectancy table - is sometimes used once enough data has been gathered on the typical performance
of test takers in a particular setting.
▪ These tables give an indication of the relation between performance on a test and success on a criterion. Tabulates
performance on the predictor measure against the criterion variable.
➢ Main Advantages of cut-off scores + expectancy tables:
▪ They provide an easily understandable way of interpreting the relationship between test scores and probable levels
of success on a criterion.
➢ Disadvantages:
▪ Correlation data can be unstable from sample to sample, so large sample sizes need to be used when establishing
cut-off scores
▪ The higher the relationship between predictor and criterion variables, the more faith in the accuracy of the
predictions.
▪ A criterion changes over time. This will influence the relationship between test scores (predictor) and the criterion-
impacts the accuracy of decisions based on scores.
▪ Band of cut-off scores rather than a single one- base a decision off of more than one test score.
▪ A measure may have differential predictive ability in relation to a criterion for various subgroups- if a cut-off score
is determined for the whole group, one or other subgroups could be discriminated against.
1.2. Reliability
❖ Reliability – the consistency with which a psychological test measures whatever it measures.
❖ Consistency always implies a certain amount of error in measurement (random error and systematic error).
➢ A person’s performance in one administration of a measure may not reflect with complete accuracy the true amount of
the trait that the individual possesses.
➢ There may be other systematic or chance factors present, i.e. person’s emotional state of mind, fatigue, noise outside
the test room etc. which may affect his/her test score on a measure.
❖ We can capture the true and error measurement in equation: X= T+E
➢ X= observed score ( the total score)
➢ T= Proportion true score (Reliability of the measure)
➢ E= Proportion error score ( Unexplained variance)
Types of reliability coefficients: ** Anastasi and Urbina (1997)
❖ Test-retest reliability- administering the test twice to the same group of test takers – interval rarely exceeding 6 months
➢ 1 form 2 sessions
➢ Coefficient of stability
➢ Reliability coefficient= the correlation between the scores obtained on the first and second application of the measure.
➢ **Sources of error variance- time sampling
❖ Alternate-form reliability- two equivalent forms of the same measure are administered to the same group on two different
occasions.
➢ 2 forms 1 or 2 sessions
➢ Coefficient of equivalence + stability
➢ Correlation of two sets of scores represents the reliability coefficient
➢ ** content + time sampling
❖ Split-half reliability- splitting the measure into two equivalent halves (after a single administration of the test) and
computing the correlation coefficient between the two sets of scores.
➢ 1 form 1 session
➢ Coefficient of internal consistency
➢ **content sampling
,❖ Inter-item consistency-
➢ 1 form 1 session
➢ Coefficient of internal consistency
➢ Obtained using the Kuder-richardson method:
▪ Formula for calculating the reliability of a test in which the items are dichotomous (KR20)
➢ Cronbach developed the Coefficient Alpha:
▪ Estimating reliability of measure where multiple response categories are present
➢ ** content sampling + content heterogeneity
❖ Inter-scorer reliability- where measures are not highly standardised procedures for administration and scoring
➢ All the test takers’ test protocols scored by two assessment practitioners
➢ Interscorer reliability coefficient
➢ The consistency of ratings between raters
➢ Expressed as an adapted form of the Cronbach alpha.
➢ **scorer differences
❖ Intra-scorer reliability
➢ Consistency of ratings for a single rater.
➢ **scorer differences
The magnitude of the reliability coefficient
❖ Standardised measure:
➢ Anastasi Urbina .80 to .90
➢ Huysamen >.85 if measures are used to make decisions about individuals >.65 groups.
➢ Smit standardised personality and interest questionnaires should have .80 to .85 while aptitude measures = / >.90
Standard measurement error (SME)
❖ Indication of probable fluctuations in a person’s observed score due to the imperfect reliability of the test.
❖ Another way of expressing reliability (SME)
**gradidge and de jager (2011) – evaluation of the reliability of a measure
1.3. Validity
❖ Validity - the appropriateness of the inferences made from test scores / a test measures what it is supposed to measure.
❖ Measurement equivalence (ME) = a specific factor analytical procedure applied for testing equivalence of a measure used
across different groups.
❖ Item response theory (IRT) and ME- aiming to achieve the same objective= establish if scales/measures are in essence
measuring the same construct
❖ validation procedures that need to be considered:
➢ content description
▪ Face validity
• Non-psychometric or non-statistical terms
• Refers to what the test appears to measure.
• Whether measure looks valid to test takers who have to undergo testing for a specific purpose.
• Testees or a panel of subject experts are normally used to assess.
▪ Content validity
• Determining whether the content of the measure covers a representative sample of the behaviour domain/
aspect (e.g. Competency) to be measured.
• Only partially a non-statistical type of validity where one part refers to a specific procedure in constructing a
psychological measure.
• Relevant for evaluating achievement, educational, and occupational measures
• Basic requirement for domain-referenced/criterion-referenced and job sample measures.
• Performance on these measures is interpreted in terms of mastery of knowledge and skills for a specific job
which are NB for employee selection and classification.
• Not the most appropriate for aptitude and personality measures
• When comparing across groups- configural invariance is the broadest and least restrictive form of ME ( fully
constrained model= factor analytically tested)
• Only when a measure is content valid can it be elevated to the next level of validity assessment - construct
validation
, ➢ Construct-identification
▪ Construct Validity
• The extent to which a measure measures the theoretical construct or trait it is supposed to measure. E.g.
intelligence, personality, verbal ability, numerical ability, spatial perception, eye-hand coordination, specific
personality facets like neuroticism
• Involves a quantitative, statistical analysis procedure.
• Statistical methods to measure construct validity:
Correlation with other tests – a high correlation between a new measure and a similar earlier measure of
the same construct indicates that the new measure assess approximately the same construct / area of
behaviour. Correlation should be only moderately high or else the measure is just a duplication of the old
one.
Factorial validity- factor analysis is a statistical technique for analysing the interrelationships of variables.
Aim= determine the underlying structure / dimensions of a set of variables, because, by identifying a
common variance between them, it is possible to reduce a large number of variables to a relatively small
number of factors/ dimensions. The factors describe the factorial composition of the measure and assist in
determining subscales. Factorial validity of a measure is thus the underlying dimensions (factors) tapped
by a measure, as determined by the process of factor analysis. Normally used when a new measure is
developed/ an existing one is applied in a different context where the original one was validated.
Convergent and discriminant validity- a measure demonstrates construct validity when it correlates
highly with other variables with which it should theoretically correlate(convergent/ mono-trait, hetero-
method) and when it correlates minimally with variables from which it should differ(discriminant / hetero-
trait, mono-method). This method is normally used to determine whether a new construct is sufficiently
‘isolated’ from other dissimilar instruments/ constructs.
Incremental validity- should be presented in addition to other validity information such as convergent and
discriminant validity. A measure displays incremental validity when it explains numerically additional
variance compared to a set of other measures when predicting a dependant variable
Differential validity- a measure possesses differential validity if it succeeds in differentiating or
distinguishing between characteristics of individuals, groups or organisations. These entities are grouped
based on a priori differences and then compared against the selected measure.
➢ Criterion-prediction- criterion related validity is a quantitative procedure that involves the calculation of a correlation
coefficient between predictors and a criterion.
▪ Concurrent validity-the accuracy with which a measure can identify or diagnose the current behaviour or status
regarding specific skills or characteristics of an individual. – implies the correlation of two or more concurrent sets
of behaviours/ constructs.
▪ Predictive validity- the accuracy with which a measure can predict the future behaviour or category status of an
individual
Table 1.2: Validation procedures
Evidence of
validity Subcategory Examples of tests and relevant
criteria
content description content validity Achievement test to determine mastery
procedures face validity of knowledge and skills in high school
mathematics.
construct Intelligence test subjected to factor
identification analysis to determine the underlying
procedures structure.
criterion prediction concurrent validity* Personality questionnaire to diagnose
procedures the presence of depression.
predictive validity Aptitude test to predict future
performance in an engineering course.